Most founders and marketing teams track LinkedIn the wrong way, focusing on likes, impressions, and follower count instead of the numbers that actually drive revenue. If you’ve ever wondered why your LinkedIn presence feels active but not productive, the missing link is simple: you’re not measuring the right LinkedIn KPIs.
LinkedIn is no longer just a “branding platform.”
It’s a pipeline engine, if you know what to track.
That’s why you need a LinkedIn Revenue Dashboard: a simple, founder-friendly system that shows whether your content is getting awareness, trust, conversations, and ultimately sales opportunities.
In this guide, you’ll learn:
- The essential LinkedIn KPIs that matter for revenue
- How to build a clean LinkedIn revenue dashboard
- The exact metrics templates founders use to measure the pipeline
- What to stop tracking (vanity metrics)
- How to turn your LinkedIn efforts into predictable outcomes
Whether you’re posting consistently or just starting out, this guide gives you the clarity you need to track your LinkedIn performance like an excelling business.
What Counts as a “LinkedIn KPI”? (And Why Most Founders Track the Wrong Ones)
LinkedIn KPIs are the measurable signals that show whether your content, visibility, and account activity are influencing pipeline, conversations, and deal flow.
A real LinkedIn KPI is something that ties back to business outcomes, such as:
- Who is engaging (ICP or random followers)?
- How many decision-makers discover your profile
- How many people move from content → DM → meeting
- Whether your content improves trust, recall, and deal velocity
Once you understand these deeper metrics, you stop chasing vanity numbers and start tracking what actually grows revenue.
Why Founders Need a LinkedIn Revenue Dashboard (Not Just Analytics)
Most founders don’t have a LinkedIn “problem”, they have a tracking problem.
You post consistently, hit decent engagement, maybe even get DMs… but you can’t tie any of it back to revenue. A LinkedIn Revenue Dashboard fixes that by helping you answer the only question that matters:
“Is LinkedIn actually generating a meaningful pipeline for my business?”
A proper dashboard reveals things the native analytics fail to show:
✔ Which posts drive leads (not likes)
Some posts get comments, but others quietly bring in inbound leads. A revenue dashboard tracks both engagement and actual conversions.
✔ Which audience segments are converting
Instead of looking at generic impressions, you can see whether:
- founders
- CMOs
- freelancers
- ops leaders
are the ones interacting → clicking → converting.
✔ What content formats have the highest ROI
Carousels vs. text posts vs. POV insights vs. frameworks.
✔ Your real pipeline velocity from LinkedIn
How long does it take someone from:
Viewing your post → Engaging → DM → Booking → Closing
✔ Where your bottlenecks are
Are you losing people at:
- Profile visit → No follow
- Follow → No DM response
- DM → No meeting
All of this lets founders fix execution instead of guessing.
The Core LinkedIn KPIs Every Founder Should Track
Most founders track everything or nothing, both of which slow your growth. The truth is, LinkedIn only has a handful of metrics that directly influence revenue, pipeline quality, and buyer intent. These are the KPIs that actually matter:
1. Content Performance KPIs (Top of Funnel Awareness)
These show whether your message is reaching the right people.
- Impressions → Are people seeing your content?
- Engagement rate → Are they responding?
- Saves & shares → Are you becoming a thought leader or just noise?
Why it matters: Visibility builds familiarity. Familiarity builds trust. Trust drives pipeline.
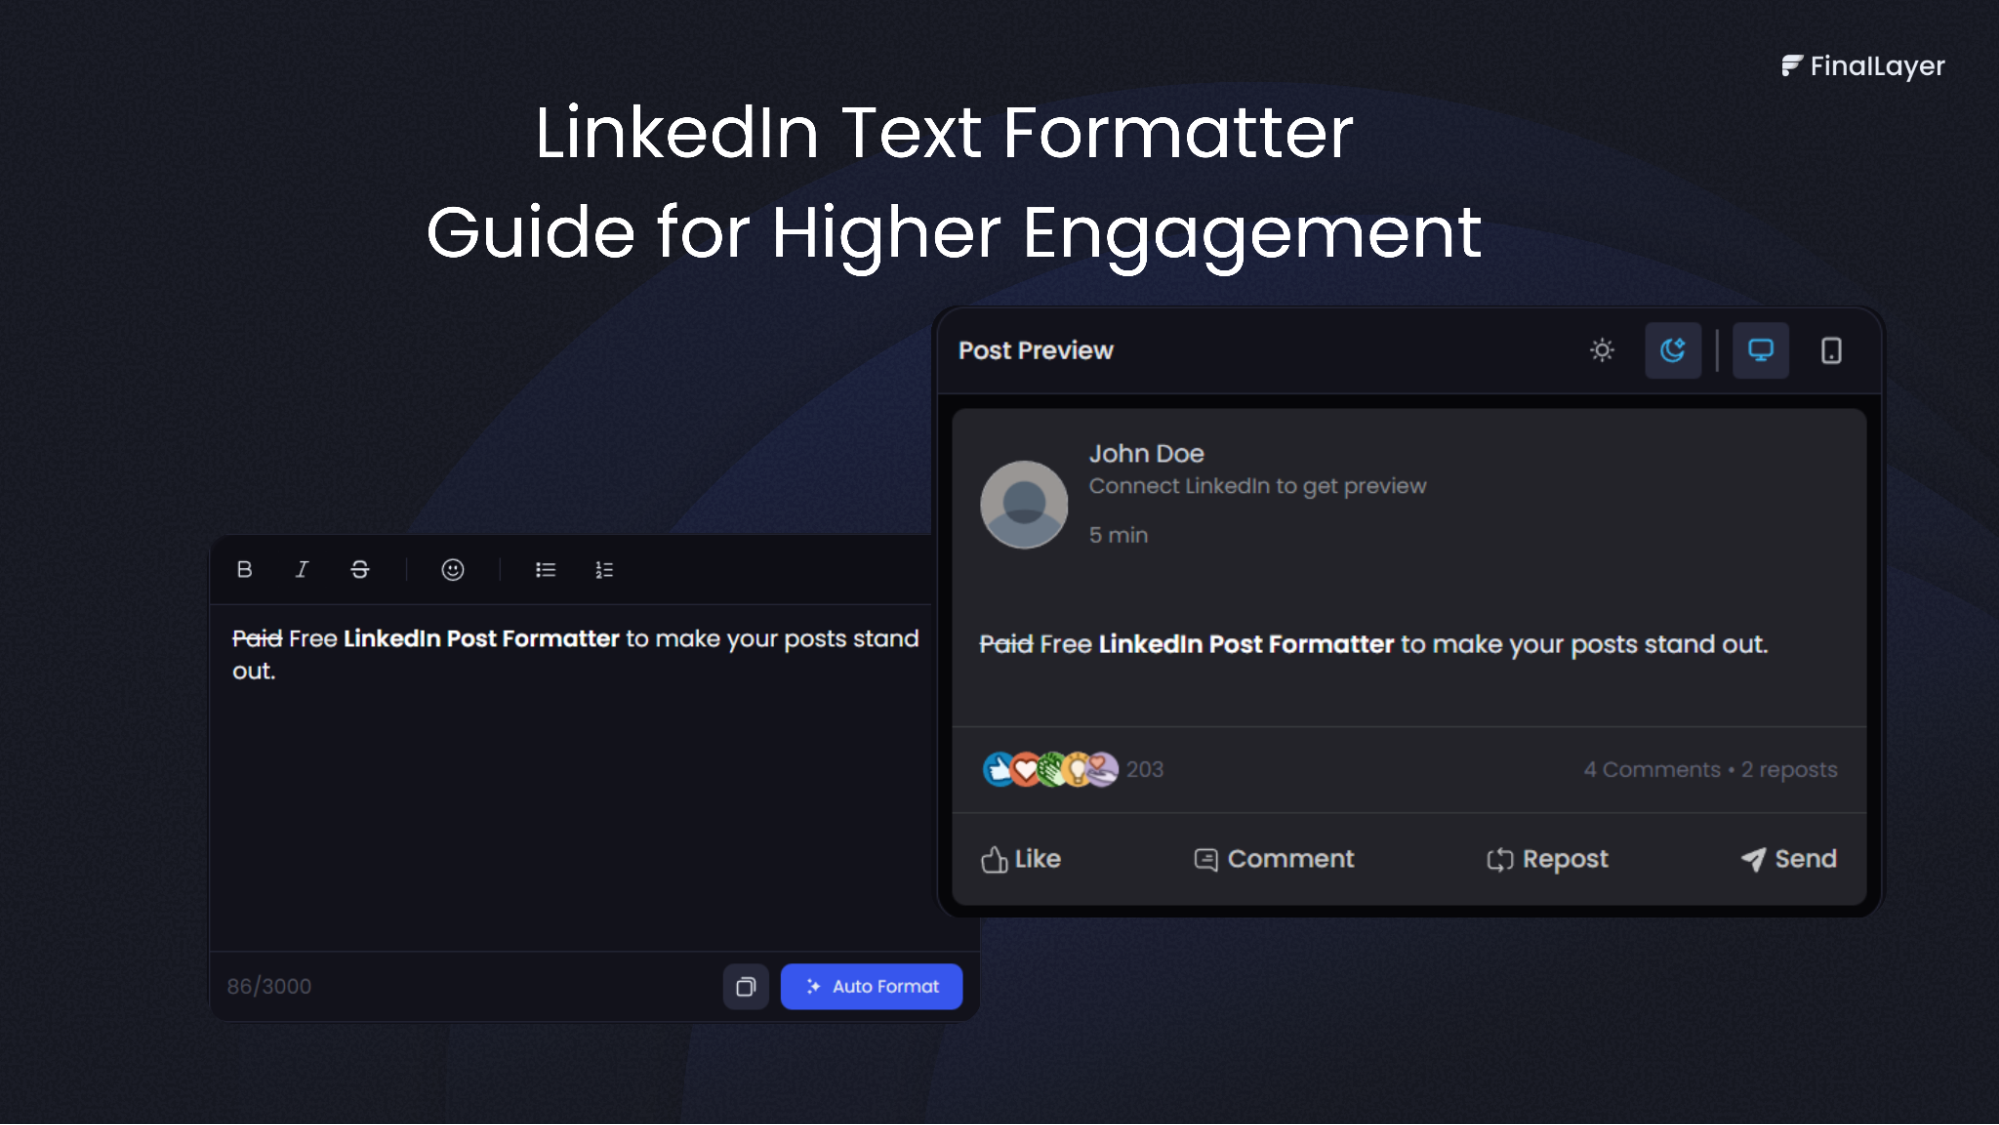
High-performing content is a mix of clarity, structure, and relevance, and that’s hard to get right consistently.
prompt and optimize for better results.
FinalLayer helps you craft scroll-stopping hooks, tighten your messaging, and transform everyday experiences into high-value insights your audience responds to.
2. Profile Performance KPIs (Mid-Funnel Consideration)
Your profile is your landing page on LinkedIn.
- Profile views → Are the right people checking you out?
- Button clicks (Visit Website / Contact) → Are they showing intent?
- Search appearances → Are you ranking for the keywords your buyers search for?
Why it matters: A high-performing profile converts lurkers into leads.
3. Audience Quality KPIs (Right People, Not More People)
Metrics that reveal whether you're attracting decision-makers.
- Follower quality (titles, industries)
- Growth from ICP segments
- Connection acceptance rate
Why it matters: A founder with 1,000 qualified followers beats one with 50,000 random ones.
4. Engagement From Ideal Accounts (Buying Signals)
Not all engagement is equal.
- Are VPs, founders, or senior managers interacting?
- Are your target accounts showing up in comments?
- Are multiple stakeholders from the same company engaging?
Why it matters: This is the strongest social-selling signal on LinkedIn.
5. Pipeline KPIs (Actual Revenue Indicators)
This is where LinkedIn shifts from “content” to “revenue.”
- Leads generated from LinkedIn
- Meetings booked from LinkedIn
- Pipeline influenced by content
- Closed-won revenue from LinkedIn touchpoints
Why it matters: This is the number your CRO cares about, the number that proves LinkedIn isn’t a “branding tool,” but a revenue engine.
The LinkedIn Revenue Dashboard Framework (Simple, Repeatable & Founder-Friendly)
A revenue-focused dashboard fixes that by grouping your metrics into three layers:
A. Visibility Layer (Top of Funnel Awareness)
These metrics show whether your audience knows you exist.
- Profile Views (daily/weekly trend)
- Post Impressions
- Search Appearances
- Follower Growth
Why do these matter:
If your visibility is weak, the pipeline will always be weak because people buy from the people they consistently see.
B. Authority Layer (Trust & Intent Signals)
These show whether people believe you can solve their problem.
- Engagement from ICP (Ideal Customer Profiles)
- Saves + Shares
- DM Replies to Value Posts
- Comments from Decision Makers
- Profile Click-Through from Posts
Why do these matter:
Authority metrics tell you if the right people are paying attention, not just “the algorithm.”
C. Pipeline Layer (Revenue Indicators)
This is where LinkedIn becomes a real sales channel.
- Inbound Demo Requests
- Warm Replies from Value-First DMs
- Leads Added to CRM
- Meetings Booked
- Revenue Attributed to LinkedIn
Why do these matter:
These metrics show the true business impact. If this layer grows, your LinkedIn strategy is working.
How Founders Should Use This Framework
You only need to measure three numbers daily, five numbers weekly, and two numbers monthly to know if LinkedIn is driving revenue:
- Daily: Profile views, post impressions, ICP engagement.
- Weekly: Lead count, DM replies, post saves/shares, follower growth, search appearances.
- Monthly: Meetings booked, revenue influenced.
This keeps tracking simple, practical, and impossible to ignore.
Templates to Track LinkedIn Revenue (Copy-Ready for Founders)
To make LinkedIn revenue tracking effortless, here are simple, copy-ready templates founders can plug into Notion, Sheets, or Airtable. These templates help you monitor what actually moves the pipeline without getting lost in vanity metrics.
Template 1: Weekly Founder LinkedIn KPI
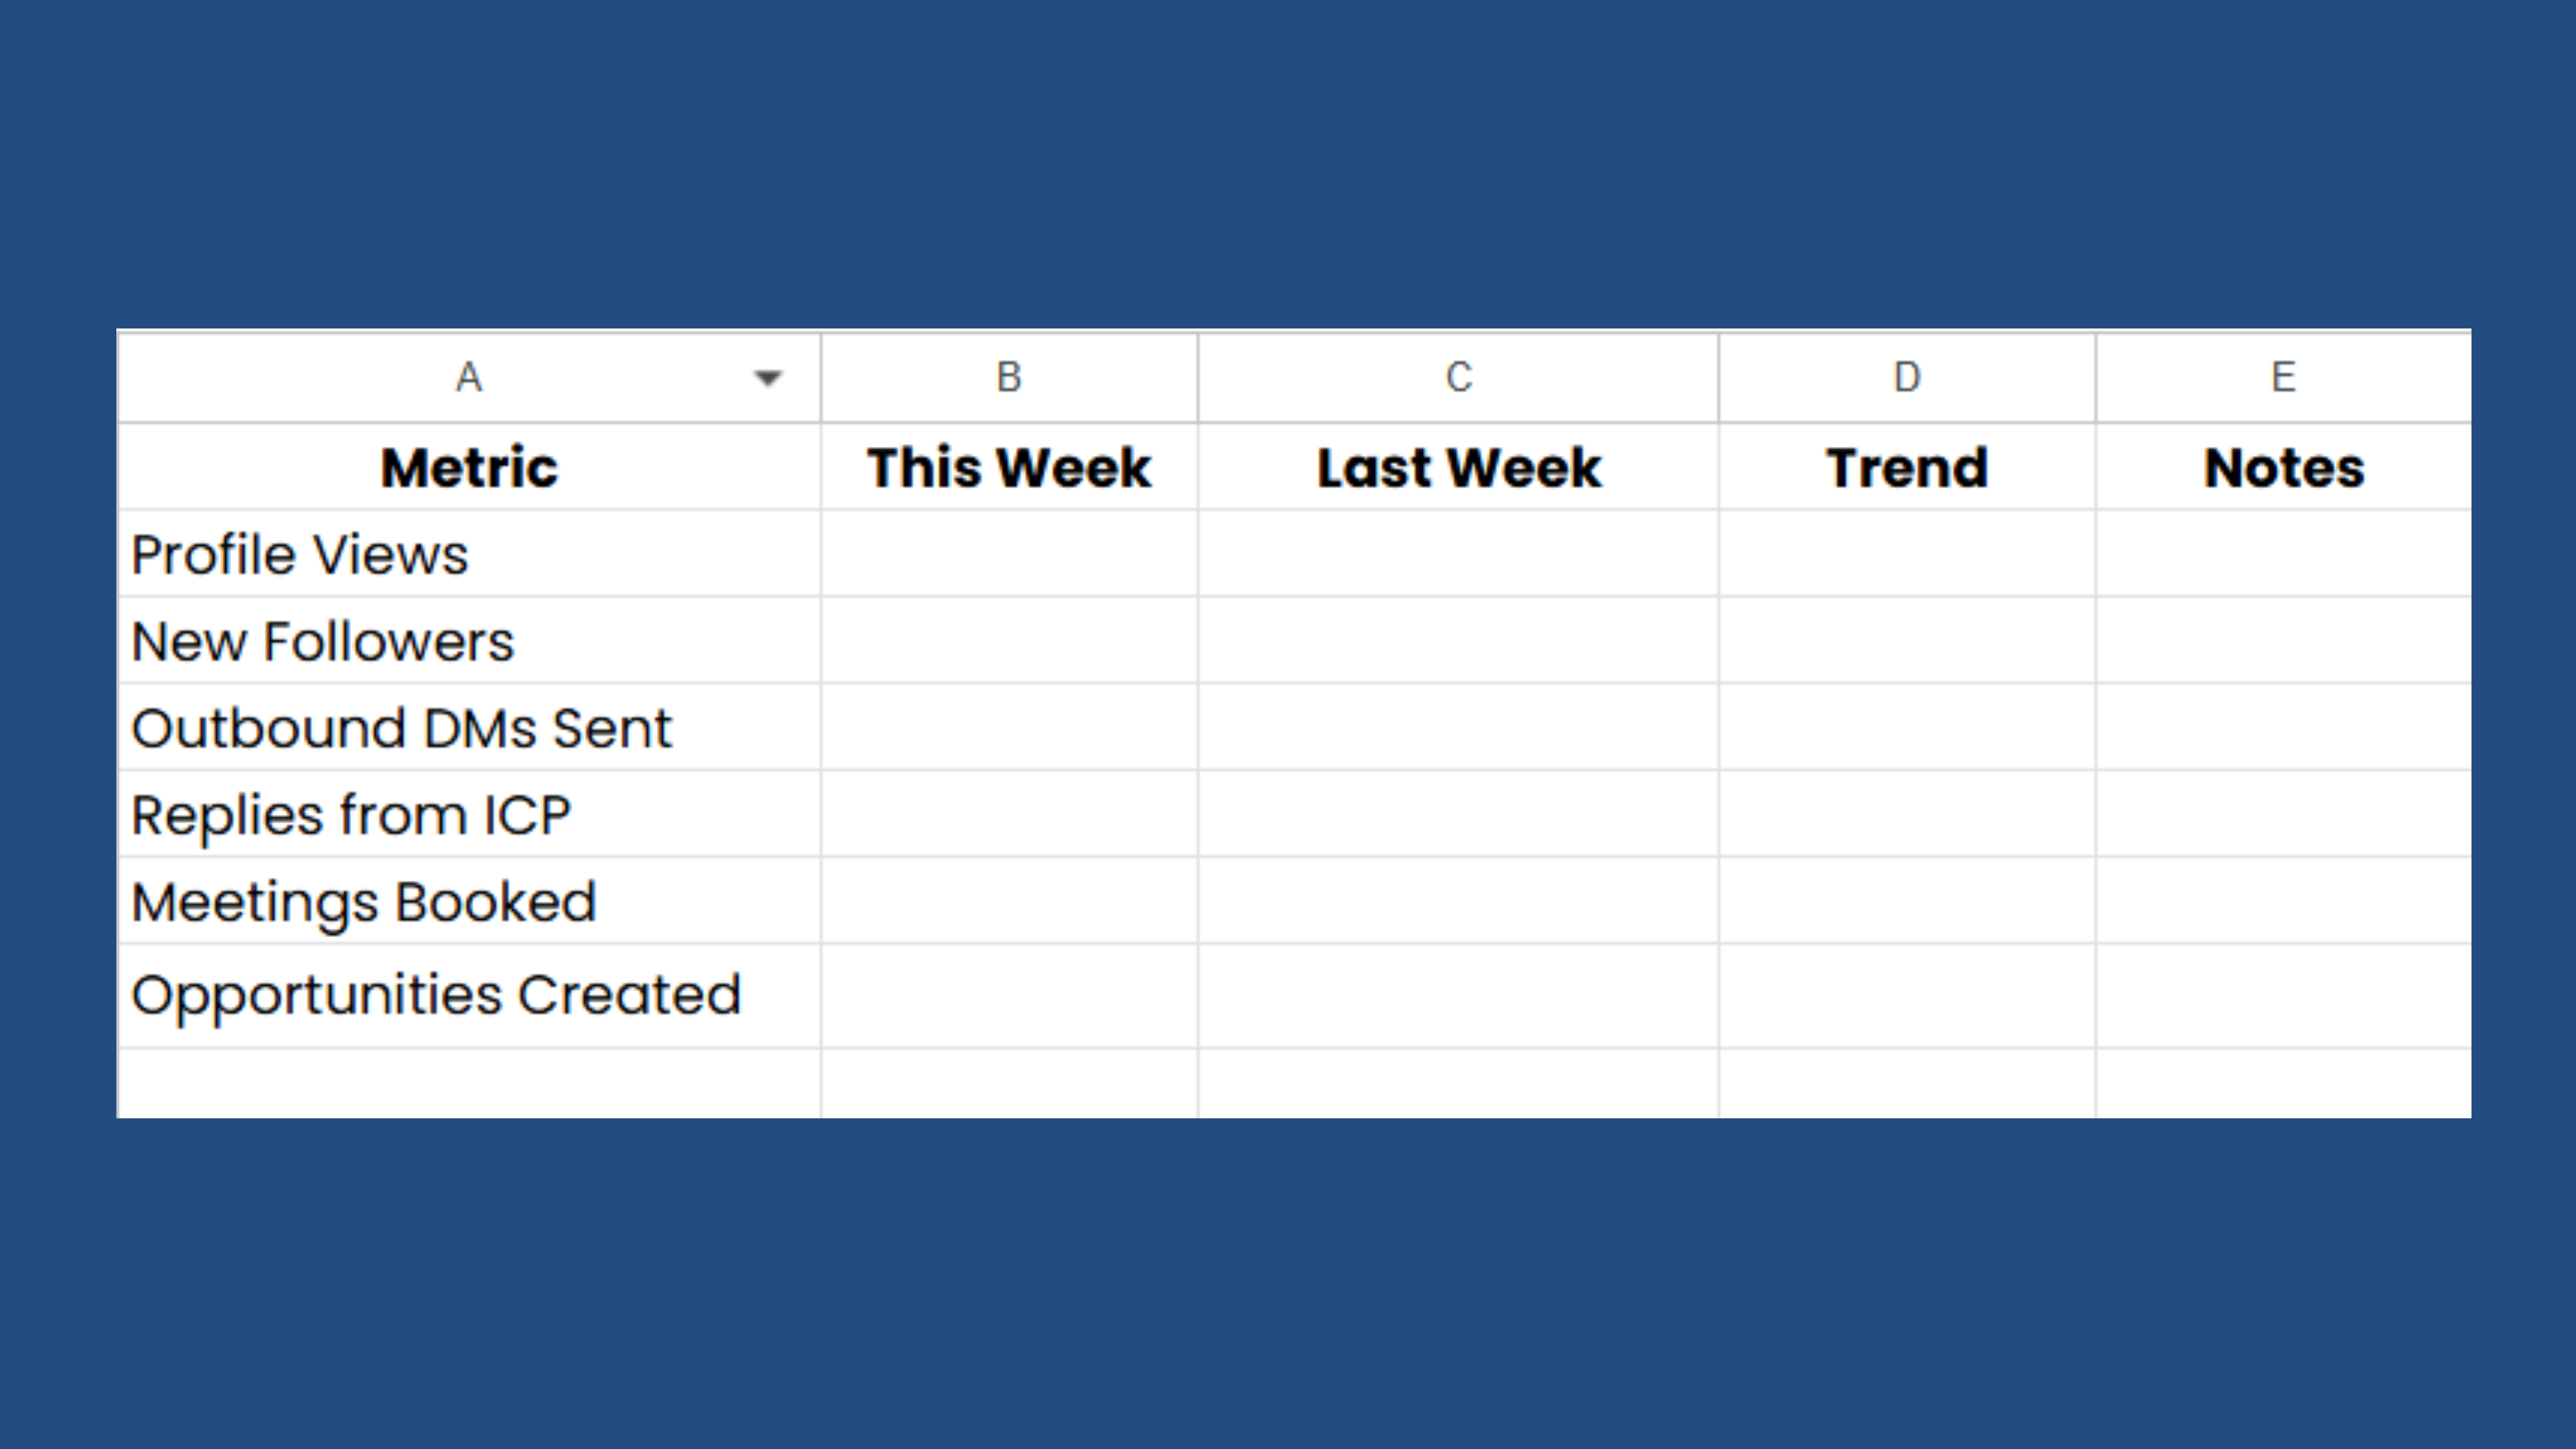
Use this to see whether your visibility → conversations → meetings pipeline is growing.
Template 2: LinkedIn Content Performance Scorecard
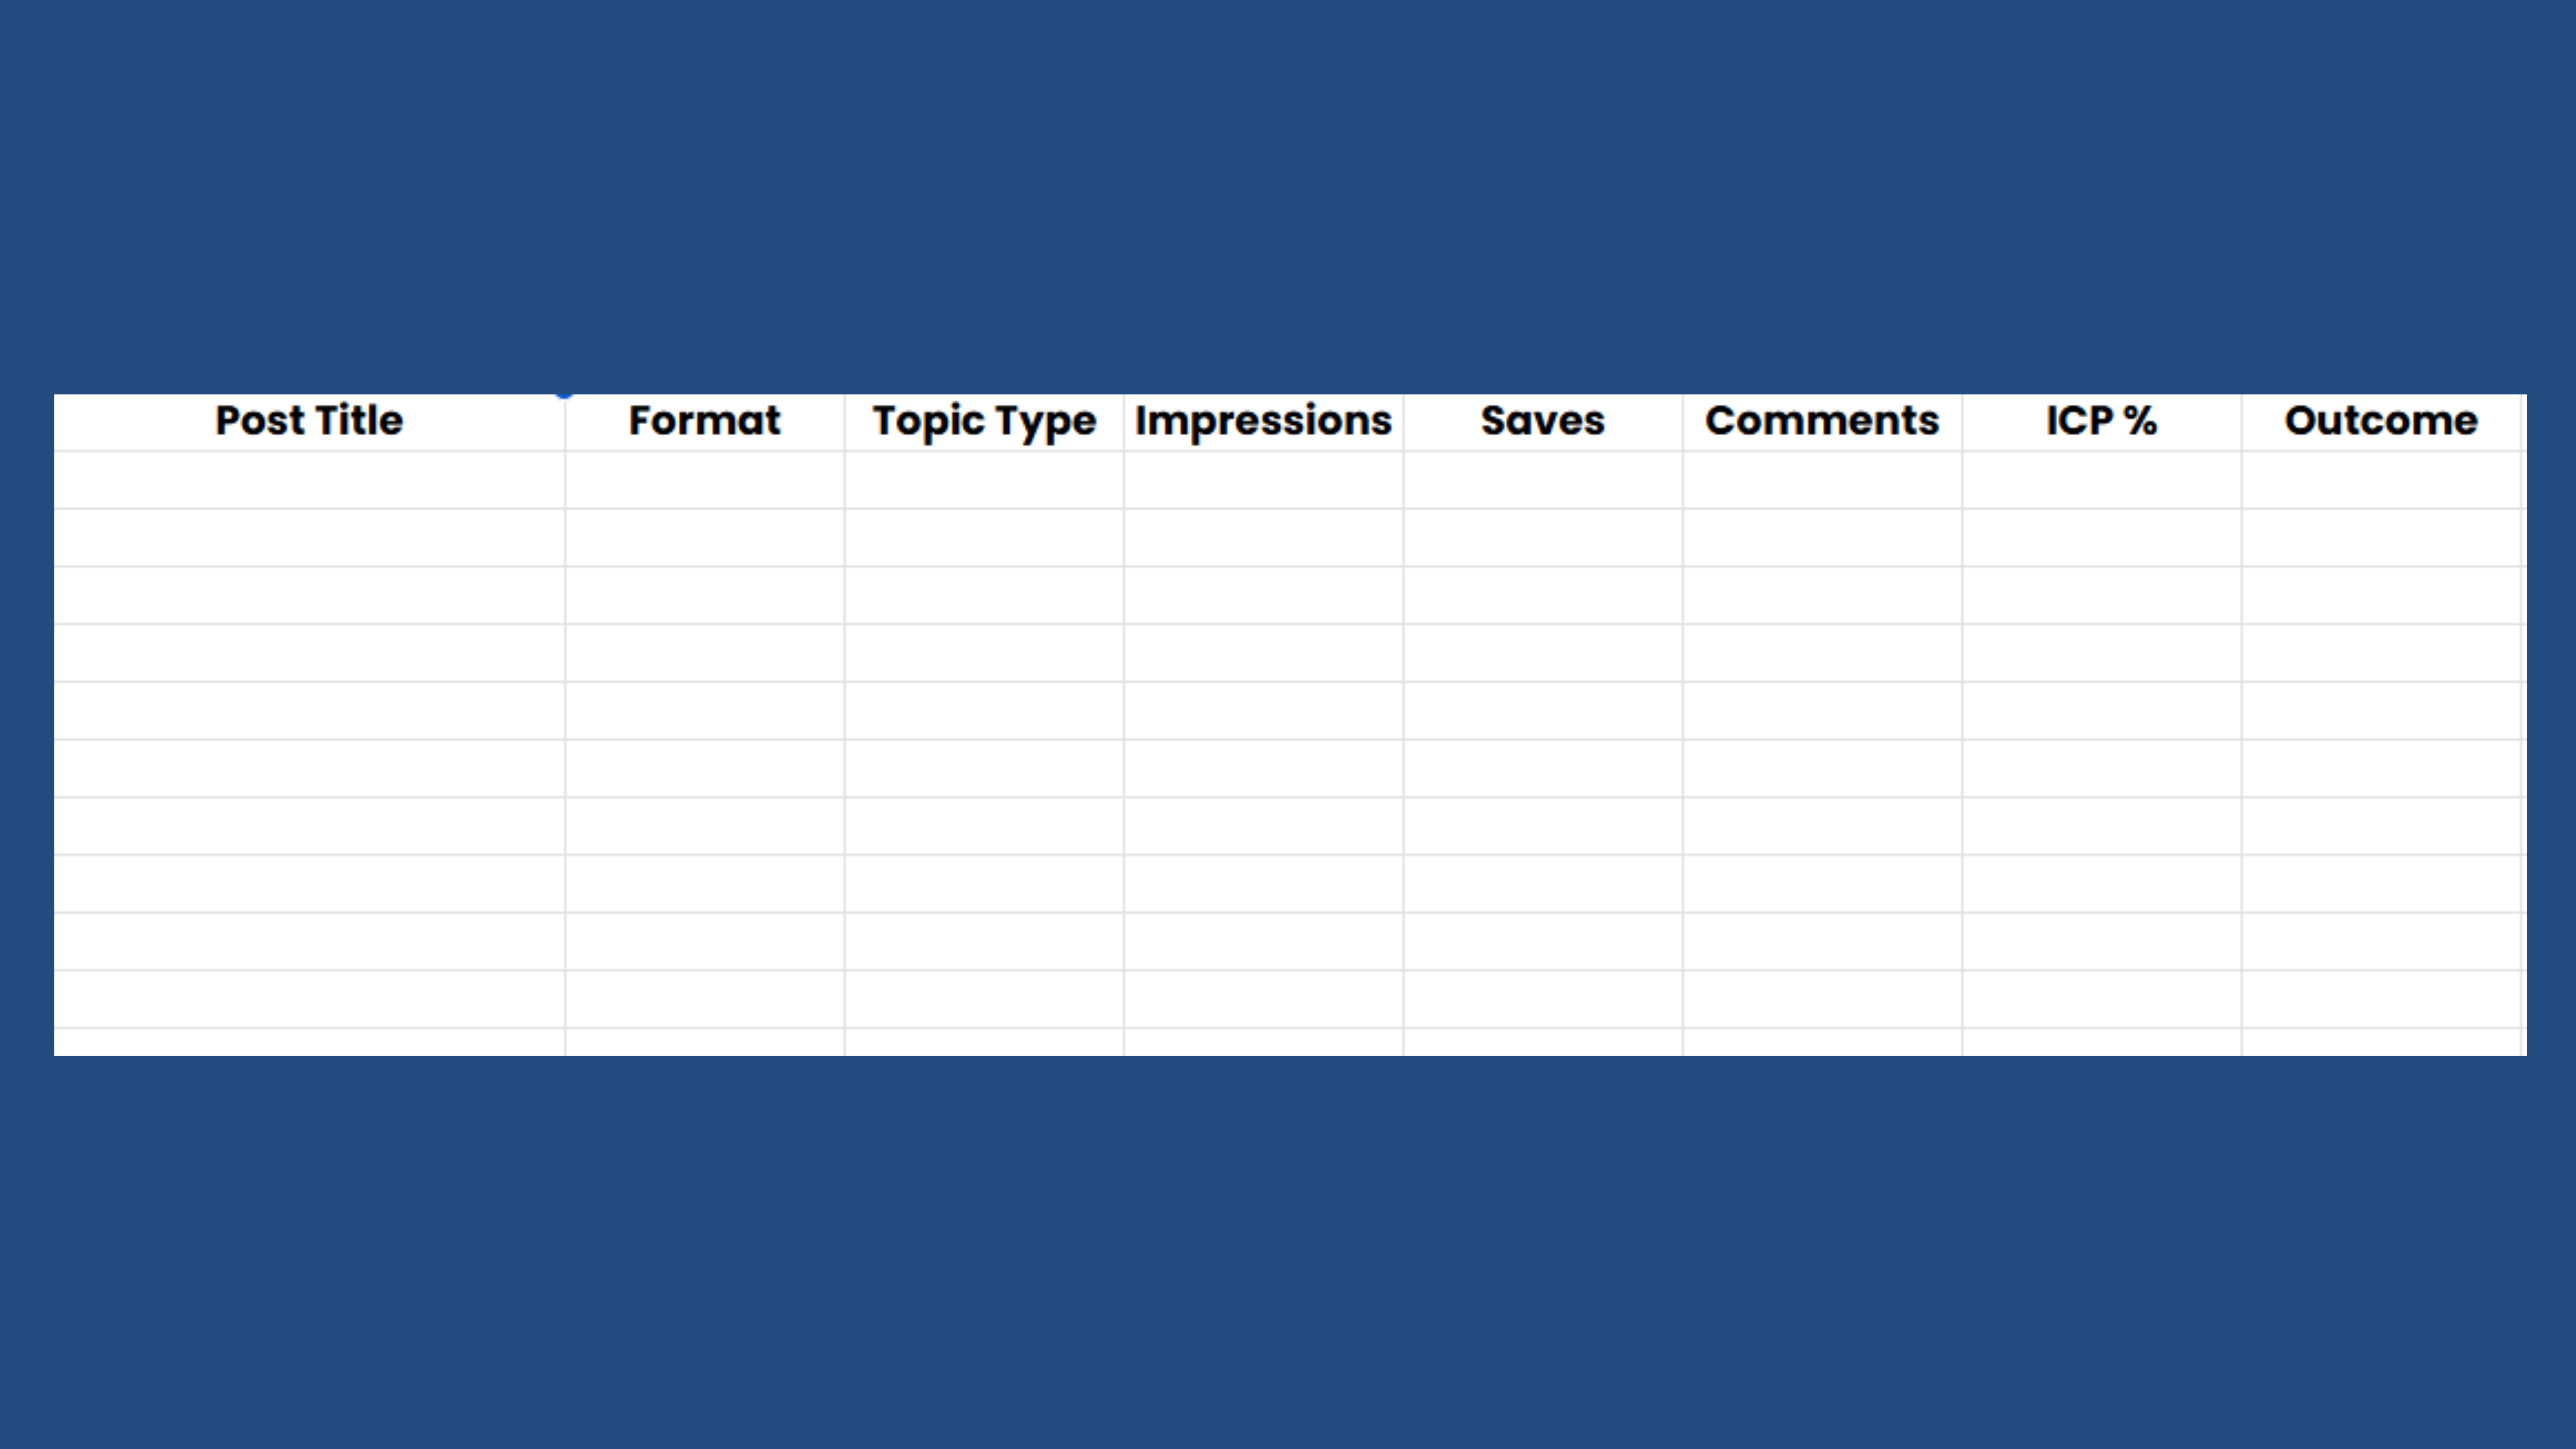
Key insight: Don’t judge posts by views, judge them by ICP engagement and conversations started.
Template 3: LinkedIn → Pipeline Attribution Tracker
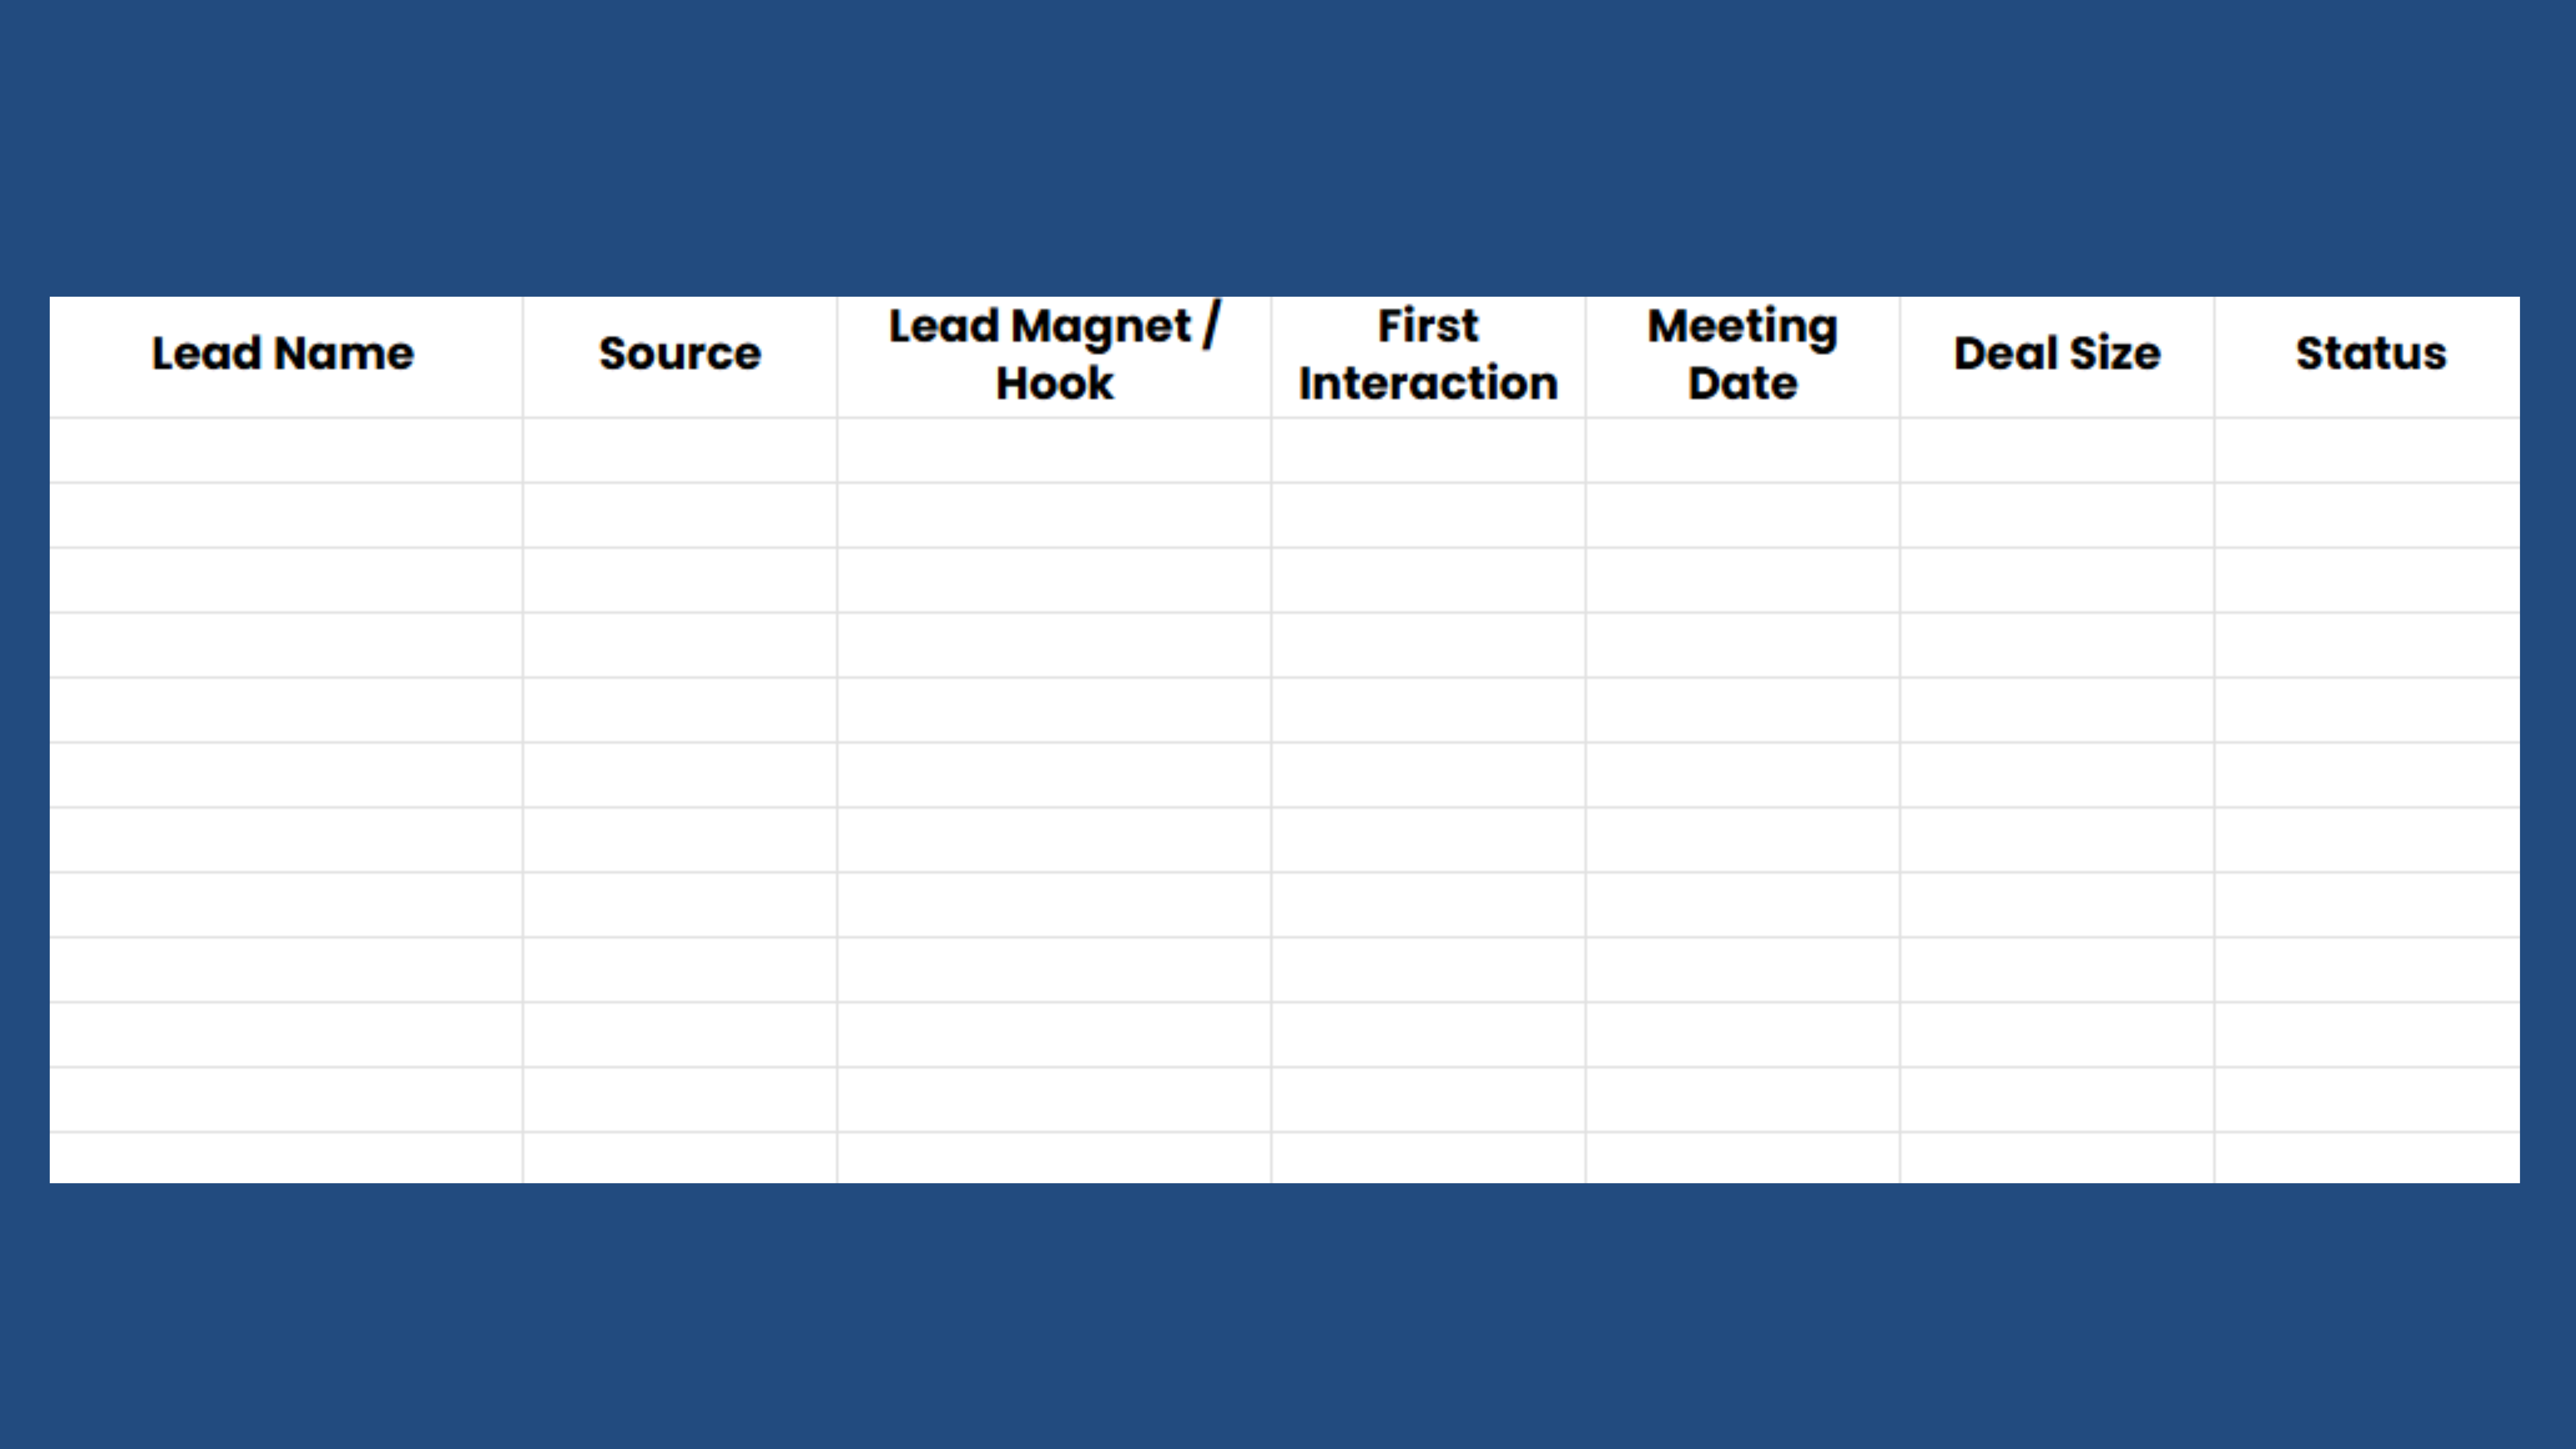
This template helps you connect posts, DMs, and conversations to actual pipeline stages.
Template 4: Daily LinkedIn Operating Checklist (Founder Edition)
- Review top notifications
- Respond to all ICP comments
- Send three warm DMs
- Engage with five ideal accounts
- Publish one high-signal post
- Track yesterday’s KPI changes
This brings structure to your consistency.
Why These Templates Work
Because they simplify founder-led LinkedIn into a daily habit system, not a guessing game, instead of tracking 30+ metrics, you focus only on the few numbers that drive revenue: visibility, conversations, meetings, and opportunities.
Final Thoughts
A revenue-driven LinkedIn strategy is built on clarity, not guesswork. When you track the right metrics, understand how buyers move through your funnel, and measure what actually contributes to the pipeline, LinkedIn becomes a predictable growth engine, not a content lottery. A well-structured dashboard gives founders and teams a single source of truth for what’s working, what’s converting, and where momentum is building. Over time, this makes every post, every interaction, and every campaign more intentional. Treat your LinkedIn data as a feedback loop, refine your direction continuously, and you’ll create a system that compounds into visibility, trust, and revenue.