Your LinkedIn profile receives dozens of views weekly, but are you truly understanding what those numbers mean? Most professionals check their LinkedIn analytics like checking the weather - they glance at the numbers but miss the story behind them. LinkedIn expert Brenda Meller reveals that many analytics features act like "glued dollar bills" - appearing valuable but offering little actionable insight. While search appearances might look impressive, profile views tell the real story of your professional magnetism. This guide cuts through LinkedIn's data maze to show you exactly which numbers deserve your attention and how to transform those insights into career-changing opportunities. Ready to stop guessing and start growing your professional presence with precision?
Understanding LinkedIn's Built-in Analytics Dashboard
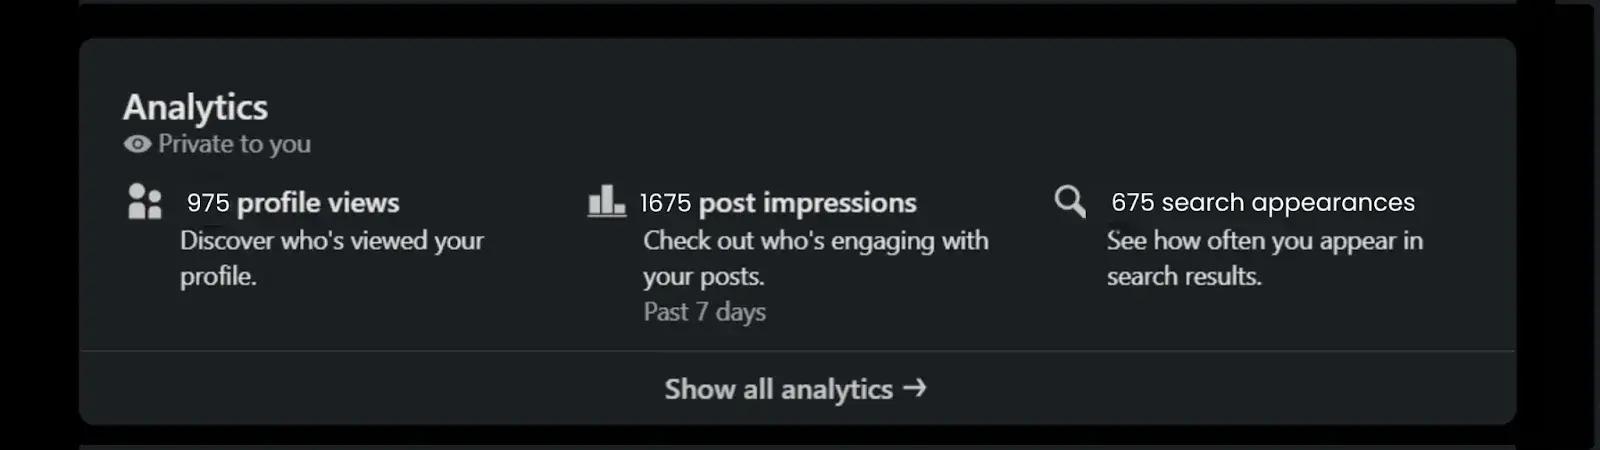
LinkedIn's analytics dashboard might seem overwhelming at first glance, but understanding its core components is your first step toward profile optimization success. The platform organizes your performance data into three distinct buckets: profile views, post impressions, and search appearances.
Profile views show who actually clicked on your profile. Post impressions reveal how many people saw your content. Search appearances indicate how often you appeared in LinkedIn's search results.
However, not all metrics are created equal. Some numbers look impressive but offer little actionable value for improving your professional presence.
Profile Views
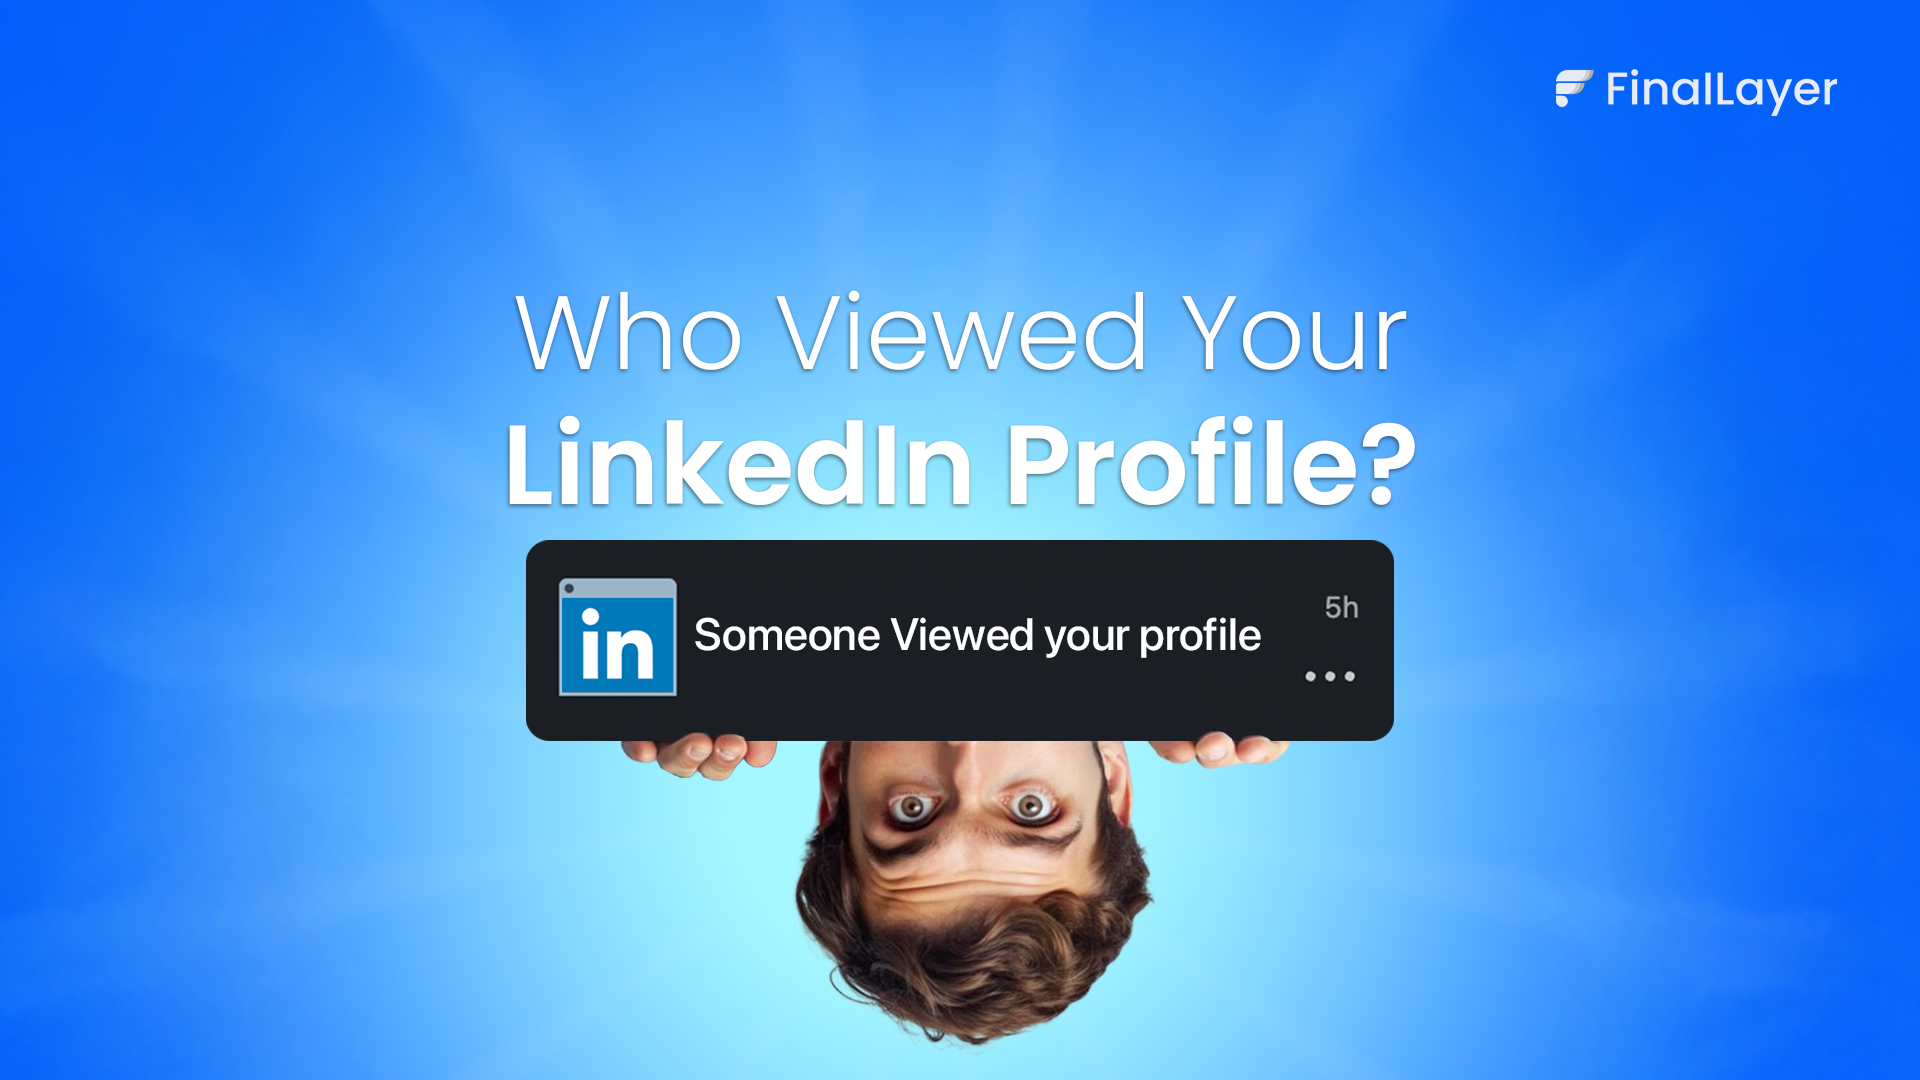
Profile views represent real human interest in your professional story. When someone clicks on your profile, they're investing their time to learn more about you. This metric provides genuine insight into your profile's attractiveness and discoverability.
For example, if you notice a spike in profile views after publishing an article about industry trends, you know that type of content resonates with your audience. Premium LinkedIn members gain access to enhanced features including detailed trend lines, viewer identities, and demographic insights about their audience.
Search Appearances
Search appearances might seem impressive when you see numbers like "500 appearances this week," but this metric has significant limitations. The data doesn't tell you whether you appeared on page one or page twenty of search results. More importantly, it doesn't confirm whether anyone actually clicked through to view your profile.
Post Impressions
Post impressions measure how many times your content appeared in LinkedIn feeds, regardless of whether people actually engaged with it. For example, if your industry insight post generated 2,000 impressions but only received 50 likes, you know your content reached a substantial audience but didn't compel them to engage. This gap between reach and engagement often signals a need to refine your content strategy or posting timing.
Profile Performance Metrics and Interpretation
Understanding your LinkedIn analytics goes beyond looking at raw numbers. The real value lies in interpreting trends, patterns, and correlations between different metrics. This interpretation helps you make informed decisions about your profile optimization efforts.
Key Performance Indicators to Track
Effective LinkedIn analytics tracking focuses on specific KPIs that align with your professional goals. Profile view trends reveal daily and weekly patterns in your visibility. For instance, B2B professionals often see higher view counts on Tuesday through Thursday, while weekend views typically drop significantly.
Viewer demographics provide crucial insights about who's discovering your profile. If you're targeting marketing directors but mostly attracting entry-level professionals, your content strategy needs adjustment. Connection status analysis helps you understand whether viewers are within your network or discovering you organically.
Benchmarking Your Profile Performance
Industry research indicates that effective LinkedIn profiles typically generate 20-50 profile views per week for active professionals. However, quality matters more than quantity. A profile receiving 15 views from qualified prospects is more valuable than 50 views from irrelevant audiences.
Understanding Search Appearance Reality
Many professionals obsess over search appearances without understanding their practical limitations. These numbers often mislead job seekers into thinking they're highly visible when they might be appearing on later pages where few people look.
Content Performance Analysis and Optimization
Share your insights about the topic by creating a LinkedIn post
How do you optimize your LinkedIn strategy using analytics?
You will have a chance to edit later
Your content performance directly impacts profile visibility and engagement. LinkedIn's algorithm favors profiles that consistently publish valuable content, making content analytics crucial for overall profile optimization.
Measuring Content Effectiveness
Content performance encompasses multiple engagement metrics that work together to boost your profile's visibility. Likes, comments, and shares create a compound effect - higher engagement signals quality to LinkedIn's algorithm, increasing your content's reach and your profile's discoverability.
Video content typically generates 5x more engagement than text-only posts. However, the completion rate matters more than initial views. A 30-second video with an 80% completion rate performs better than a 3-minute video with a 20% completion rate.
Content Strategy Optimization
Effective content strategies focus on educational value rather than promotional messaging. How-to content and industry insights consistently generate higher engagement rates than company announcements or sales pitches.
Consider timing your content publication based on your audience's online activity. LinkedIn analytics show when your connections are most active, allowing you to optimize posting schedules for maximum visibility.
Profile Optimization Strategies Based on Analytics
Analytics insights should drive specific optimization actions rather than just satisfying curiosity. Data-driven profile enhancement focuses on elements that directly impact your key performance indicators.
Data-Driven Profile Enhancement
Your headline optimization should be based on search appearance data and viewer demographics. If analytics show you're attracting the wrong audience, your headline keywords need adjustment. For instance, a financial advisor targeting small business owners might change from "Financial Advisor" to "Small Business Financial Growth Strategist."
A/B testing different profile elements helps identify what resonates with your target audience. Test different professional photos, headline variations, and summary approaches while monitoring their impact on profile views and connection requests.
Competitive Analysis and Benchmarking
Understanding competitor performance helps identify optimization opportunities within your industry. Analyze top performers in your field to understand their content strategies, posting frequencies, and engagement patterns.
Advanced Analytics Techniques and Best Practices
Sophisticated LinkedIn users employ advanced techniques like systematic A/B testing and predictive analytics to maximize their profile performance and stay ahead of platform changes.
A/B Testing for Profile Optimization
Systematic testing approaches help identify which profile elements drive the best results. Test one variable at a time - profile photos, headlines, or summary sections - while monitoring changes in key metrics over 2-4 week periods.
For instance, a technology consultant tested two headline approaches: "Technology Consultant | Digital Transformation Expert" versus "Helping Companies Modernize Technology for 50% Faster Growth." The second version generated 40% more profile views from decision-makers.
Predictive Analytics and Trend Identification
Advanced users leverage seasonal trend analysis for optimal posting times and content themes. Economic indicators and industry events often correlate with engagement spikes, allowing you to time your content for maximum impact.
Algorithm optimization requires continuous monitoring and adaptation. LinkedIn frequently updates its algorithm, affecting reach and visibility patterns. Stay informed about these changes and adjust your strategy accordingly.
Getting Started with LinkedIn Analytics
Begin by accessing and familiarizing yourself with LinkedIn's native analytics dashboard. Document your baseline metrics including current profile views, search appearances, and post engagement rates. This baseline provides context for measuring improvement over time.
Set up regular monitoring schedules - weekly for active optimization periods, monthly for maintenance phases. Identify key performance indicators aligned with your professional goals, whether that's increasing brand awareness, generating leads, or attracting career opportunities.
Conclusion
LinkedIn analytics mastery transforms your professional presence from guesswork to precision targeting. Understanding which metrics truly matter - profile views over search appearances, engagement quality over quantity, and business outcomes over vanity metrics - enables you to optimize your LinkedIn strategy for real results.
The key lies in focusing on actionable data that drives meaningful professional opportunities. Whether you're seeking career advancement, building a consulting practice, or expanding your professional network, analytics-driven optimization ensures every hour invested in LinkedIn generates measurable returns.
Start with LinkedIn's native analytics to understand your current performance, then gradually incorporate advanced techniques like A/B testing and third-party integrations as your optimization sophistication grows. Remember, the goal isn't perfect analytics - it's leveraging data insights to achieve your professional objectives more efficiently and effectively.