Data Analytics
Data analytics is the systematic process of collecting, organizing, and analyzing raw data to extract meaningful insights that inform business decisions. With recent advancements in technology, including artificial intelligence (AI), machine learning (ML), and natural language processing (NLP), organizations across various industries are leveraging data analytics to drive strategic decision-making, enhance customer experiences, and optimize operations. This multifaceted domain encompasses four primary types of analytics: descriptive, diagnostic, predictive, and prescriptive—each serving distinct business objectives and providing crucial insight into what has happened, why it occurred, what may happen next, and the best courses of action to take. In today’s fast-paced digital landscape, the relevance of data analytics has never been more pronounced. As organizations find themselves inundated with vast volumes of data generated daily, effective data analytics empowers them to navigate complexities and make informed decisions backed by evidence. The adoption of innovative data analytics tools is on the rise, with expectations that the market will reach monumental figures driven by the need for actionable intelligence. Notably, as more companies implement data-driven approaches—reporting productivity gains and profit growth—the role of data analytics as a critical component of business intelligence becomes increasingly apparent. Companies that harness this technology stand to gain significant competitive advantages, thereby shaping the future of their industries.
Which numbers should you pay attention to in your LinkedIn analytics and which ones should you ignore?
You should focus on profile views and search appearances as valuable metrics. Profile views indicate who actually clicked on your profile, showing genuine interest in your content. However, search appearances data has limited value - it shows job titles and companies where you appeared in searches, but doesn't reveal if you were on page one or deeper in results, or if viewers took any action. This data serves LinkedIn's goal of keeping you on the platform longer to view more ads rather than providing actionable insights for your networking or job search efforts.
Watch clip answer (06:35m)
Brenda Meller | Meller Marketing 🥧LinkedIn
00:17 - 06:52
What are the top embedded analytics tools and their key strengths?
The video highlights four leading embedded analytics tools with their distinct strengths. Qlik Sense excels in customizable integrations with an open-source library that facilitates integrations across environments and automation options for data lifecycle management. Microsoft Power BI stands out for security and compliance, offering business-focused cybersecurity features including user authentication against Azure ID. Looker, a Google Cloud product, specializes in data modeling with capabilities to track changes and review database history while seamlessly integrating with data pipelines. Finally, Tableau leads in data visualization with drag-and-drop functionality for creating visualizations for web pages, portals, and external-facing applications.
Watch clip answer (01:31m)
TechnologyAdvice
00:59 - 02:31
What is the difference between LinkedIn profile views and search appearances, and which one is more valuable?
Profile views are more valuable than search appearances because they represent people who actually clicked to visit your profile, while search appearances only show how many times you appeared in search results without indicating if people viewed your profile. Search appearances don't reveal whether you appeared on page 1 or page 14 of results, making this metric less actionable. Importantly, LinkedIn Recruiter users are excluded from profile views data, so job seekers shouldn't be discouraged if recruiters aren't visible in their views. Rather than waiting for recruiters to reach out, Brenda recommends proactively connecting with recruiters, optimizing your profile, and staying active on the platform to enhance your job search efforts.
Watch clip answer (07:36m)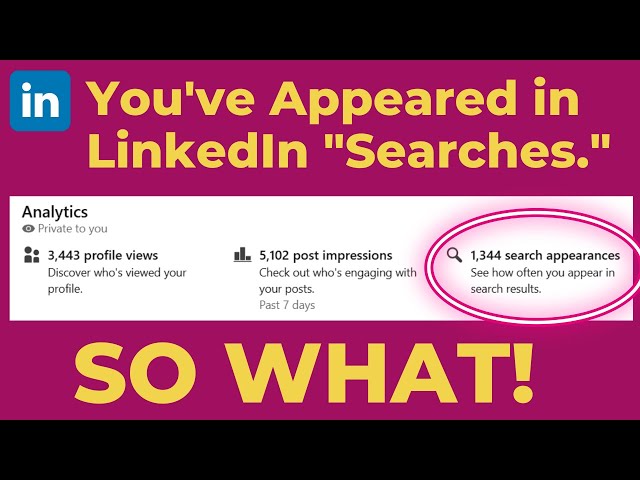
Brenda Meller | Meller Marketing 🥧LinkedIn
01:13 - 08:50
What are the key content performance metrics identified in the Altimeter Group's 2021 State of Digital Content report?
According to the Altimeter Group's 2021 report, the five key content performance metrics are: engagement (36% of respondents), efficiency, inbound traffic, conversion, and reach. Engagement measures how content resonates with audiences, while efficiency demonstrates ROI through cost savings such as decreased call center contacts. Inbound metrics track website analytics like time spent and referring URLs. Michael Brito suggests mapping these metrics to the buyer's journey framework rather than viewing them in isolation. This approach makes measurement more actionable by showing where content strategy adjustments are needed throughout the customer journey, allowing marketers to better understand performance and make targeted improvements to different content types and storytelling techniques.
Watch clip answer (03:26m)
Michael Brito (Britopian)
00:43 - 04:10
What are the key features and benefits of Python in Excel?
Python in Excel integrates directly into the Excel environment through the new PY function, requiring no installation. Users can leverage popular Python libraries like Pandas and matplotlib within their Excel workbooks to create visualizations, train machine learning models, and perform advanced analytics. The system runs securely in Microsoft Cloud as a compliant Microsoft 365 service, protecting data privacy. This integration works seamlessly with Excel's native features including formulas, charts, pivot tables, and conditional formatting, combining Excel's flexibility with Python's analytical power to enhance data-driven decision making and storytelling.
Watch clip answer (01:25m)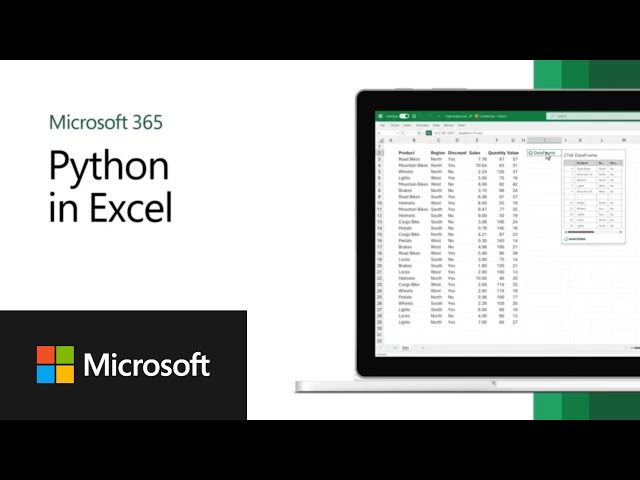
Microsoft 365
00:02 - 01:27
How is generative AI transforming Business Intelligence in 2025?
Generative AI has evolved from an emerging technology to a proven force reshaping how businesses handle data. In 2025, solutions like Microsoft Copilot and Databricks Genie have overcome previous enterprise concerns around security and data governance, enabling widespread adoption of AI in business analytics. These tools have transformed BI platforms by making data-driven decision making accessible to everyone in an organization, not just technical experts, allowing businesses to uncover insights, simplify processes, and make decisions faster and smarter.
Watch clip answer (06:37m)
The Data Lab
02:24 - 09:02