Data Analytics
Data analytics is the systematic process of collecting, organizing, and analyzing raw data to extract meaningful insights that inform business decisions. With recent advancements in technology, including artificial intelligence (AI), machine learning (ML), and natural language processing (NLP), organizations across various industries are leveraging data analytics to drive strategic decision-making, enhance customer experiences, and optimize operations. This multifaceted domain encompasses four primary types of analytics: descriptive, diagnostic, predictive, and prescriptive—each serving distinct business objectives and providing crucial insight into what has happened, why it occurred, what may happen next, and the best courses of action to take. In today’s fast-paced digital landscape, the relevance of data analytics has never been more pronounced. As organizations find themselves inundated with vast volumes of data generated daily, effective data analytics empowers them to navigate complexities and make informed decisions backed by evidence. The adoption of innovative data analytics tools is on the rise, with expectations that the market will reach monumental figures driven by the need for actionable intelligence. Notably, as more companies implement data-driven approaches—reporting productivity gains and profit growth—the role of data analytics as a critical component of business intelligence becomes increasingly apparent. Companies that harness this technology stand to gain significant competitive advantages, thereby shaping the future of their industries.
What are pivot tables and why are they important in Excel?
Pivot tables are one of Excel's most powerful features that allow users to extract significance from large, detailed data sets. They help transform raw data into meaningful insights by summarizing information like employee data, total hours, and patient metrics. What makes pivot tables especially valuable is their ability to automatically update when the source data changes. This live updating feature extends to any charts created from the pivot table, ensuring all visualizations stay current without manual intervention. This dynamic connection between source data, pivot tables, and charts creates an efficient workflow for data analysis in Excel.
Watch clip answer (07:14m)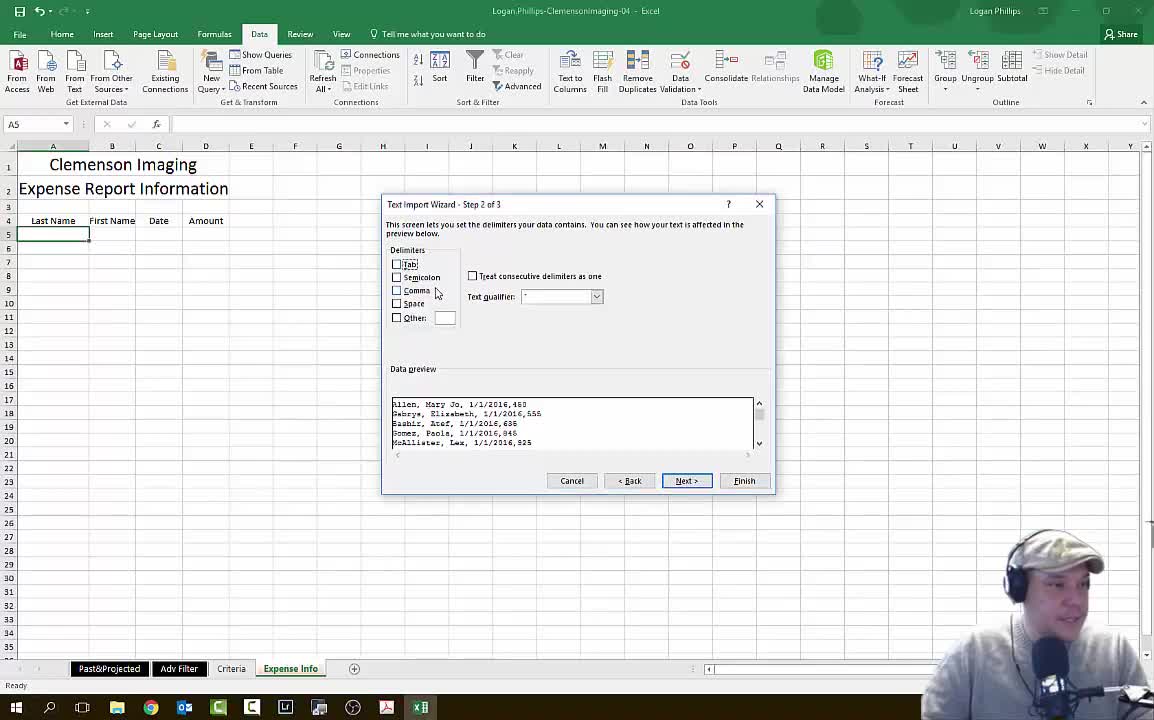
Logan Phillips
25:06 - 32:20
How is AI and machine learning being utilized in the Proteus Maritime Domain Awareness Program?
AI and machine learning are helping Proteus process large volumes of imagery data at real-time speeds, which is crucial since vessels are continuously moving across vast oceans. The technology enables vessel identification by classifying ship types based on metrics like length and width. Additionally, AI algorithms have been tailored to detect specific fishing behaviors like long line, purse seine, and drift net fishing, helping identify illegal, unregulated, and unreported fishing activities. This capability allows authorities to monitor vessel tracks and recognize suspicious patterns that vary from day to day, significantly enhancing maritime surveillance effectiveness.
Watch clip answer (02:47m)
GovCIO Media & Research
15:38 - 18:26
How is data science transforming life sciences research?
Data science is revolutionizing life sciences through advanced analysis of vast biological datasets. It plays crucial roles in genomics, where machine learning algorithms analyze genetic variations linked to diseases, and proteomics, where it helps identify key proteins and pathways. Most significantly, it enables personalized medicine by analyzing patient data to tailor treatments to individual needs. Additionally, data science has improved drug discovery by analyzing molecular and chemical data, leading to more effective targeted therapies and deeper understanding of disease mechanisms.
Watch clip answer (05:40m)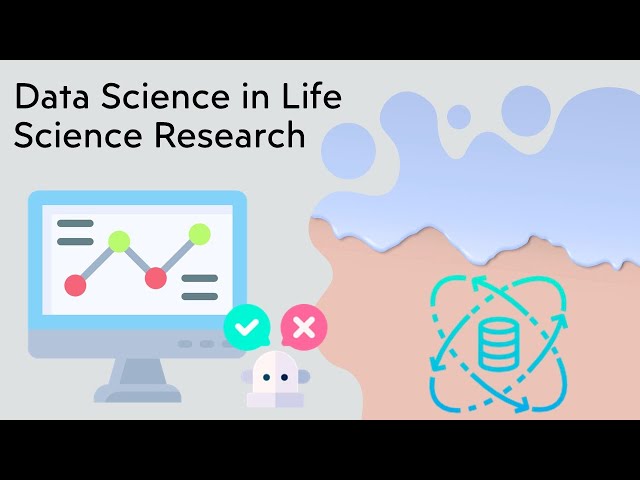
BioTech Whisperer
00:59 - 06:39
How can multiple visualizations be organized in Tableau?
In Tableau, multiple visualizations can be organized by grouping them together into a cohesive dashboard. The speaker demonstrates this by working with four different visualizations, first labeling one as "enrollment total" and then planning to group all four visuals together for a more comprehensive view. This grouping feature allows users to combine related visualizations into a single display, making it easier for viewers to see connections between different data points. By organizing multiple charts and graphs together, Tableau enables more effective data storytelling and helps highlight important insights that might not be apparent when viewing visualizations separately.
Watch clip answer (00:17m)
IPDAE
40:31 - 40:48
What is the Power platform and how does it enhance Microsoft's cloud services?
The Power platform is Microsoft's suite of cloud services that extends beyond the standard Dynamics 365 applications. It gives users the ability to create additional powerful functionality beyond the pre-built applications. Power BI, a key component users are increasingly hearing about, allows for enhanced data analytics and reporting capabilities. As part of Microsoft's cloud services ecosystem, the Power platform empowers organizations to develop custom solutions tailored to their specific needs. This self-service approach enables users to build functionality without extensive technical expertise, making it a valuable asset for public sector and nonprofit organizations seeking to modernize their operations.
Watch clip answer (00:24m)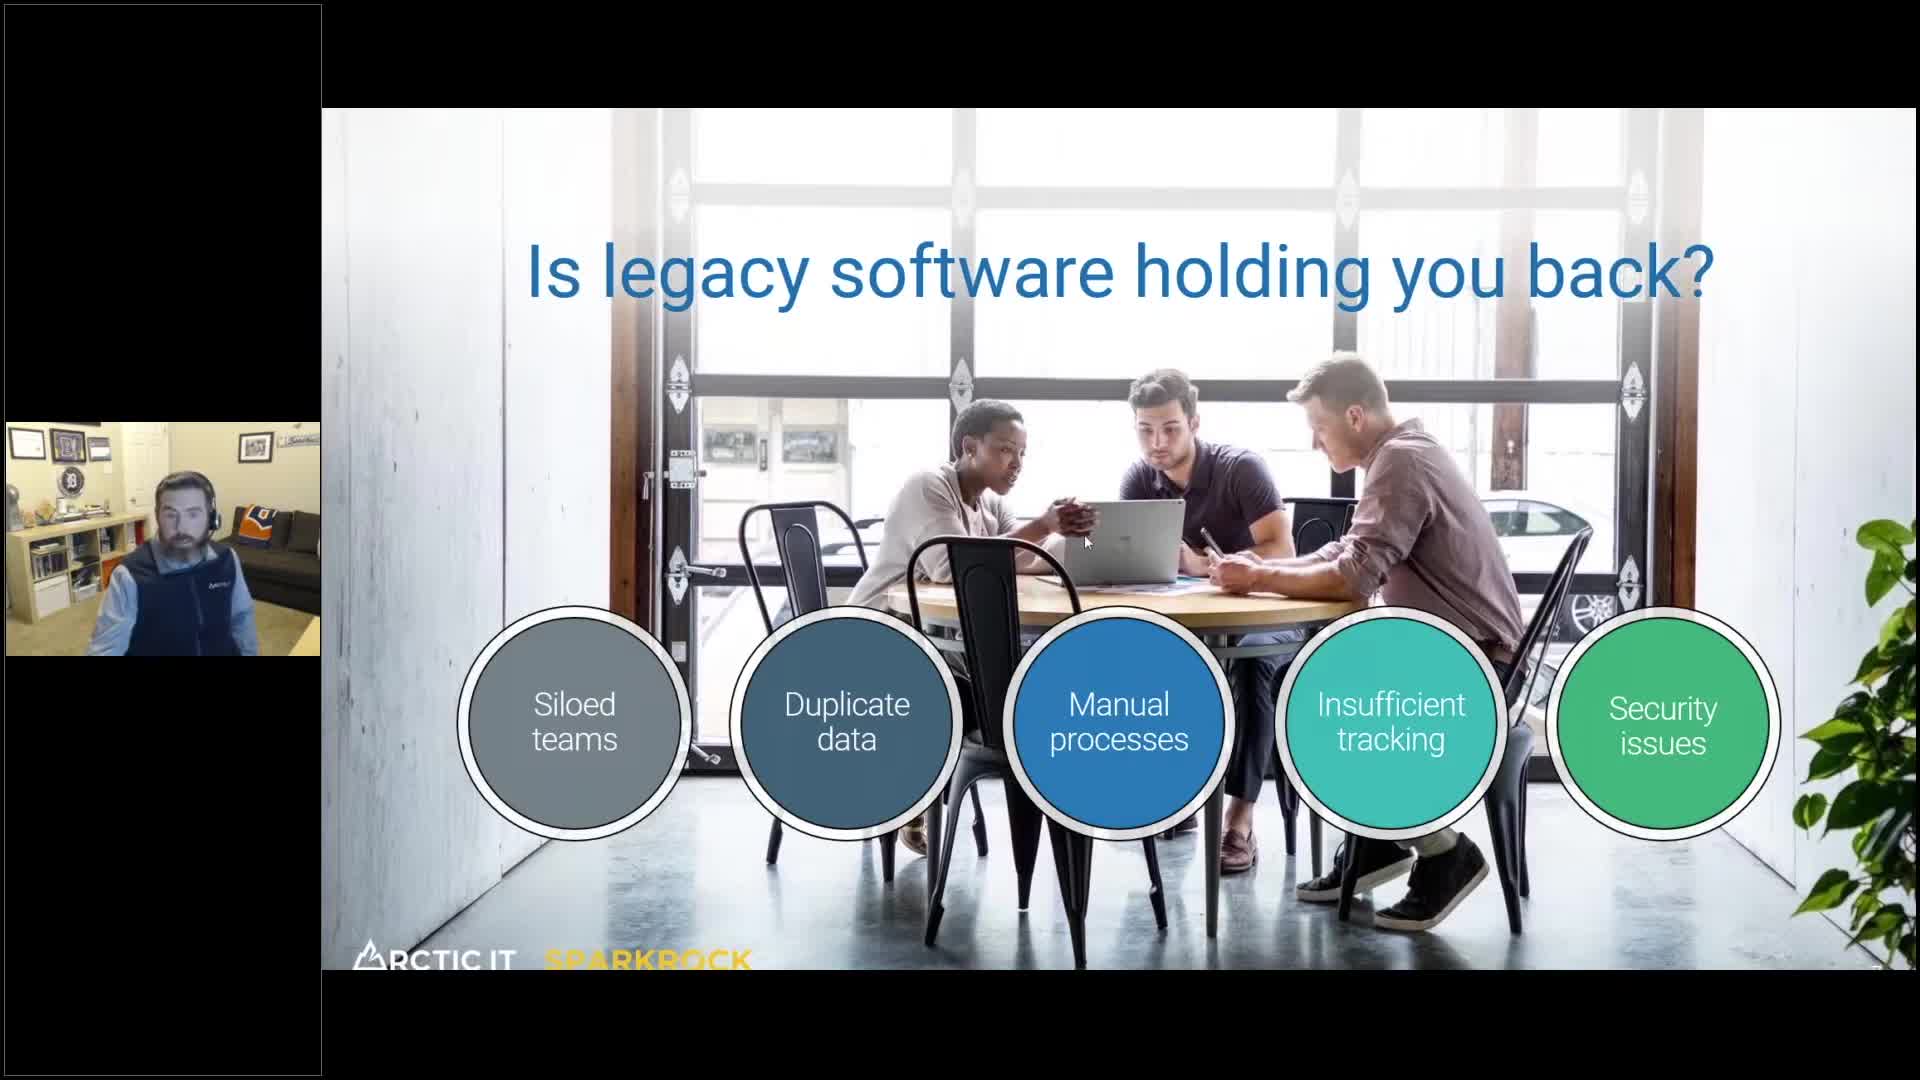
Arctic IT
12:59 - 13:23
What are the essential skills needed to be an effective data analyst?
Effective data analysts must be comfortable with data, able to analyze it thoroughly, and possess curiosity to continually question what the data reveals. They need foundational statistical knowledge, including understanding correlations and variables, combined with technical skills like SQL, R, and Python. However, the most powerful analysts don't just present technical analysis but translate their findings into actionable insights. They connect data to business context and tell compelling stories that lead to recommendations. The value of analysis lies not in showing how it was done, but in framing insights that drive decisions—translating complex findings into clear guidance for stakeholders.
Watch clip answer (03:00m)
DataCamp
26:48 - 29:48