Financial Markets
Financial markets play a pivotal role in the global economy, serving as platforms where buyers and sellers can trade financial assets, including stocks, bonds, currencies, and derivatives. These markets facilitate essential transactions between capital providers such as investors and savers, and capital seekers like corporations and governments. The dynamics of financial markets influence investment strategies and stock market analysis, making understanding their mechanics vital for both individual and institutional investors. Recent trends indicate that as the global economy continues to evolve, the significance of online trading platforms has surged, with a keen focus on identifying the best trading platforms to optimize trading strategies. In recent assessments, financial markets have demonstrated resilience amidst challenges such as inflationary pressures and geopolitical uncertainties. A cautious yet optimistic environment has emerged, especially in mergers and acquisitions (M&A) and initial public offerings (IPOs), signaling potential opportunities for growth. With demand for investment-grade private credit and asset-backed finance on the rise, along with notable activity in equity markets, understanding the state of financial markets involves navigating a complex landscape of opportunities and risks. Key players in these markets are increasingly leveraging technology and integrating artificial intelligence into their operations, ensuring that they remain competitive in a rapidly changing financial landscape. Overall, the mechanisms of trading platforms and profound effects of market fluctuations continuously shape investment strategies and opportunities within financial markets.
What exactly are meme coins and how have they evolved?
Meme coins are highly volatile cryptocurrencies inspired by popular internet or cultural trends that carry no intrinsic value but can dramatically fluctuate in price. Originally created as jokes or parodies, they have evolved from internet humor into multi-billion dollar assets attracting both casual investors and major financial institutions. These digital assets have gained significant traction through speculative interest and are often tied to celebrities, politicians, and viral trends. Meme coins serve as indicators of retail investor interest in cryptocurrency markets and generally reflect the risk appetite of investors at any given time, making them particularly susceptible to dramatic price swings.
Watch clip answer (01:03m)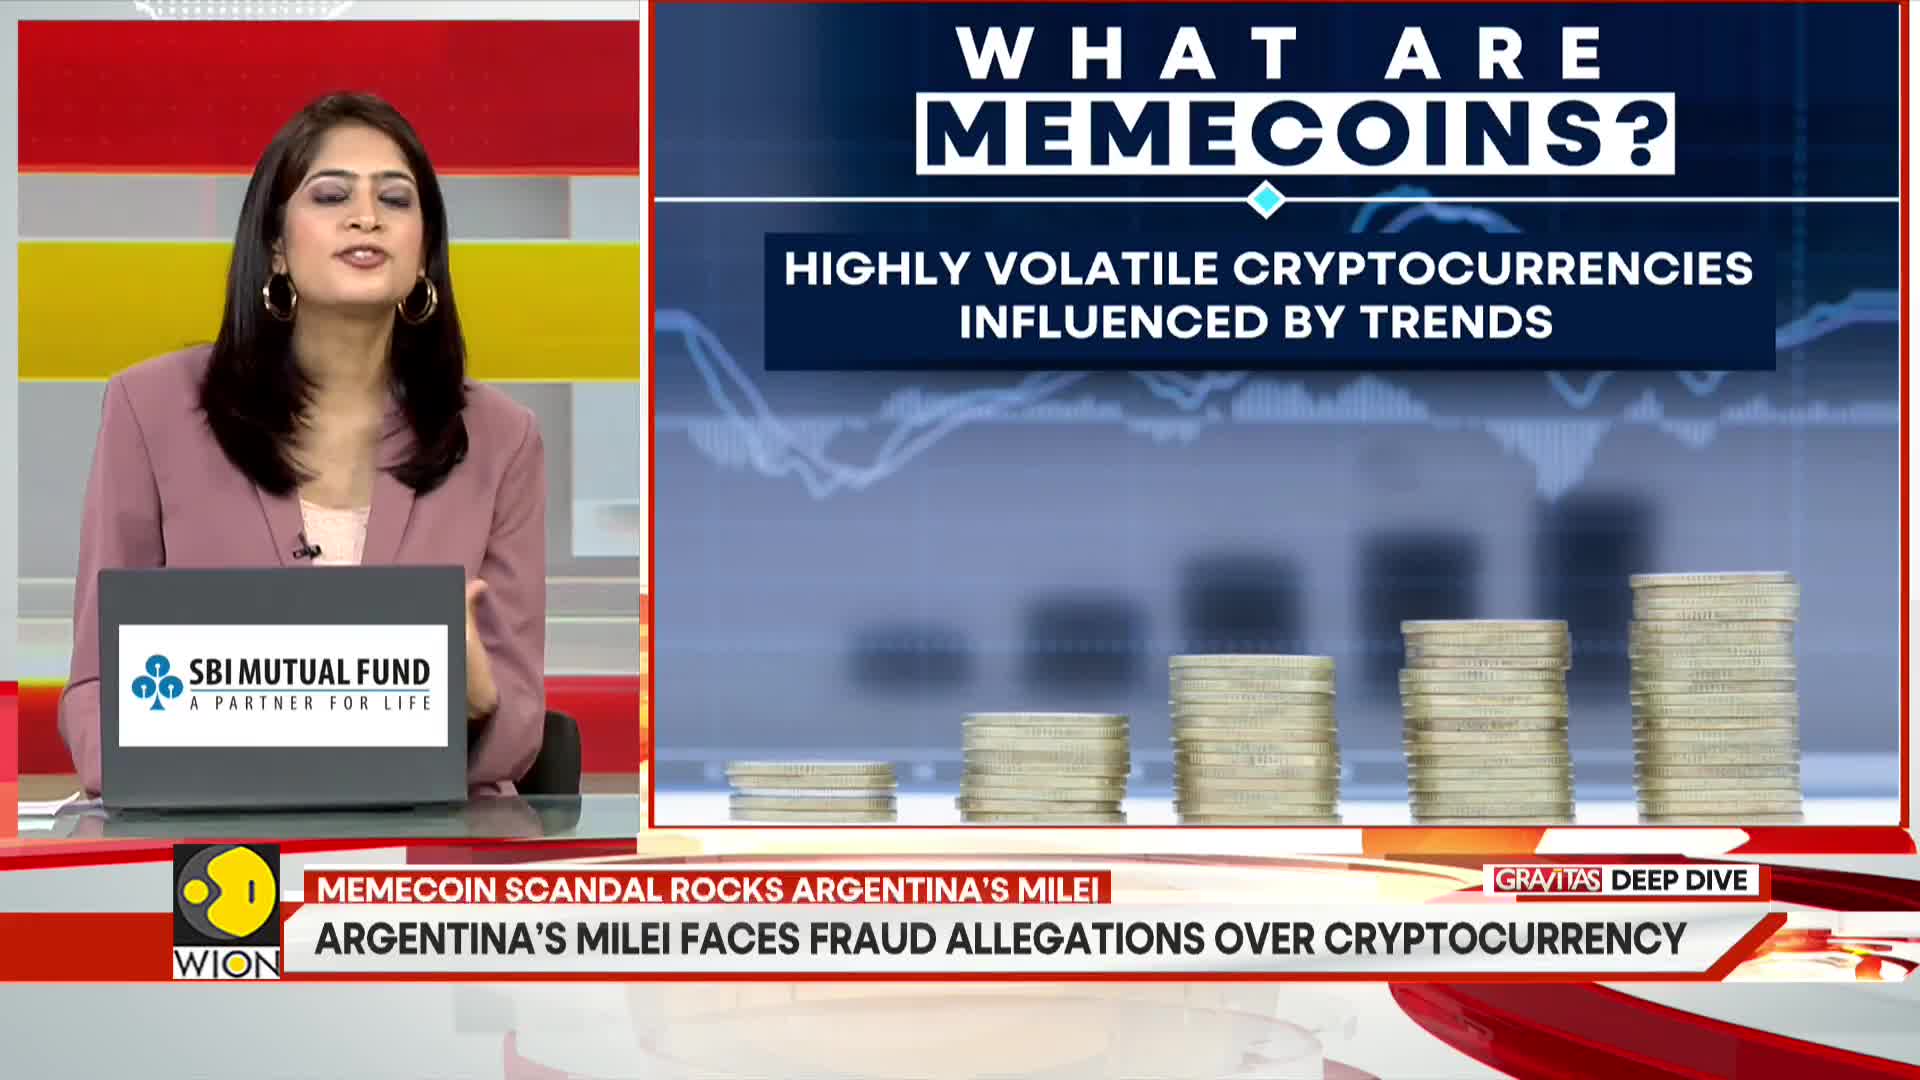
WION
02:04 - 03:07
How did the Indian stock markets perform in the recent trading session?
The Indian stock markets exhibited volatility, with the Sensex dropping 29.47 points to close at 75,967.39 and the Nifty50 ending 14.20 points lower. The indices tested support at 22,800 before recovering mid-session. Sector-wise, IT and energy led the gains, while FMCG and auto sectors saw corrections. Mid-cap stocks ended slightly lower, dropping 0.2%, while small-cap stocks underperformed, shedding 1.7%. Analysts anticipate sideways trading within the 22,800-23,100 range, with future movements dependent on decisive breakouts. Overall market sentiment remains cautious as investors monitor global trends.
Watch clip answer (01:16m)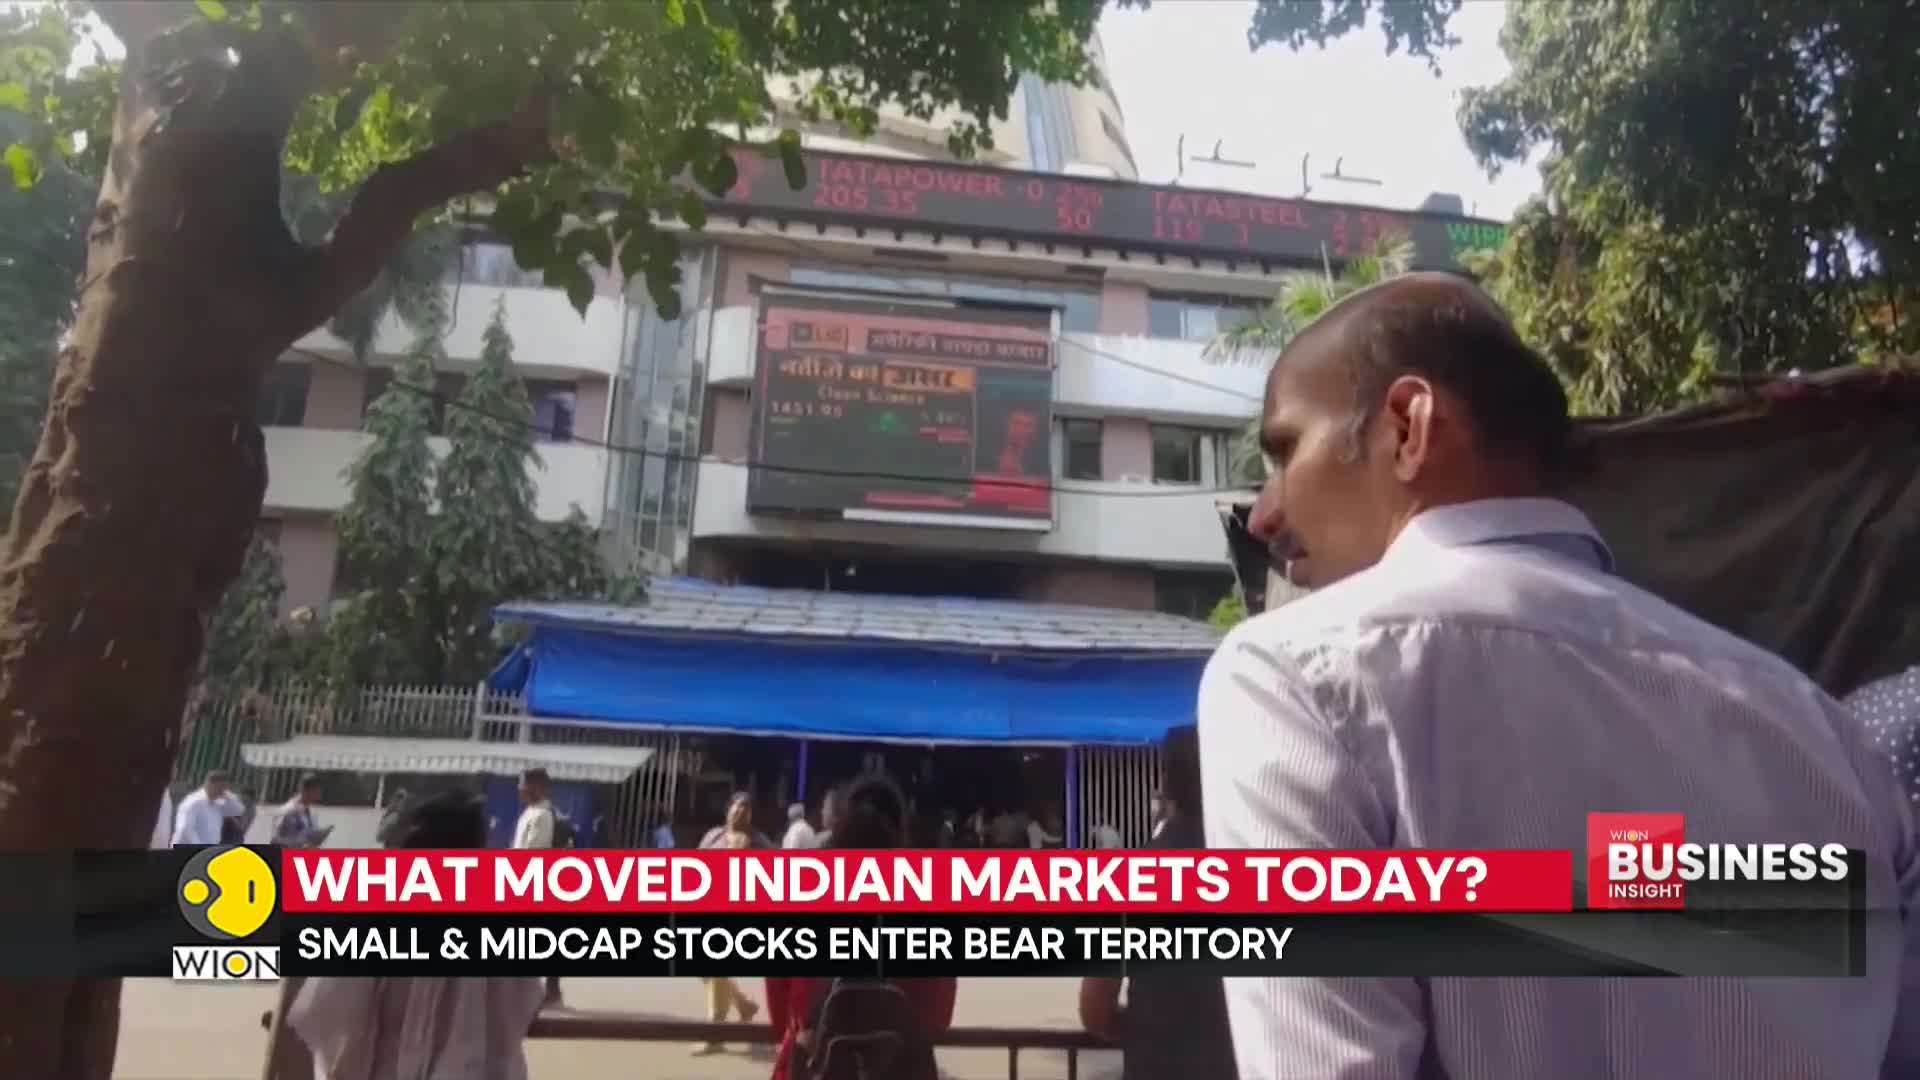
WION
00:00 - 01:16
What is the current performance of different market sectors and what can investors expect in the near term?
IT and energy sectors are leading the gains in the market, while FMCG and auto sectors are experiencing corrections. Analysts predict that markets may continue to trade sideways within the range of 22,800 to 23,100 in the near term. A decisive breakout will determine the next major market move. If the Nifty breaks below 22,800, further correction may follow, whereas a move past 23,000 could signal renewed bullish momentum. However, overall investor sentiment remains cautious as they monitor global market trends and upcoming economic events.
Watch clip answer (00:38m)WION
00:38 - 01:16
What is the expected trading range for the Indian stock market and what could trigger a major market move?
Analysts suggest that the Indian markets may continue to trade sideways within the range of 22,800 to 23,100, with 22,800 serving as a critical support level that was tested before a mid-session recovery. A decisive breakout on either side of this range will determine the next major market movement direction. If the Nifty breaks below 22,800, further correction may follow, indicating bearish pressure. Conversely, a move past 23,000 could signal renewed bullish momentum. Despite these potential directional indicators, the overall market sentiment remains cautious, with investors closely monitoring global market trends and upcoming economic events.
Watch clip answer (00:54m)WION
00:21 - 01:16
What is the current state of Indian stock markets and what are analysts predicting for near-term market movement?
The Indian stock markets experienced volatility with the Sensex falling by 29.47 points to close at 75,967.39 and the Nifty50 ending slightly lower. The indices tested a critical support level at 22,800 before staging a mid-session recovery. Sector performance was mixed with IT and energy sectors gaining while FMCG and auto sectors faced corrections. Analysts suggest markets may continue to trade sideways within the range of 22,800 to 23,100 in the near term. If Nifty breaks below 22,800, further correction may follow, while a move past 23,000 could signal renewed bullish momentum. Overall investor sentiment remains cautious as participants closely monitor global market trends and upcoming economic events.
Watch clip answer (01:16m)
WION
00:00 - 01:16
What is the current trading range for the Indian stock market and what might trigger its next major move?
The Indian stock market is currently trading sideways within the range of 22,800 to 23,100, with indices having tested support at 22,800 before staging a mid-session recovery. Analysts suggest that a decisive breakout on either side will determine the market's next major move. If the Nifty breaks below 22,800, further correction may follow, while a move past 23,000 could signal renewed bullish momentum. Meanwhile, sector performance has been mixed with IT and energy sectors leading gains, whereas FMCG and auto sectors saw corrections, with the small cap index underperforming by shedding 1.7%.
Watch clip answer (00:54m)WION
00:21 - 01:16