Data Analysis
Data analysis is a vital process that transforms raw data into actionable insights, enabling organizations to make informed decisions across various sectors, including business intelligence, healthcare, and finance. This systematic approach involves several key steps, such as collecting, cleaning, and interpreting data, utilizing statistical and logical techniques to derive meaningful patterns and forecasts. As big data continues to grow exponentially, effective data analysis becomes crucial in helping businesses optimize operations and enhance decision-making processes. Recently, the adoption of advanced technologies like artificial intelligence (AI), machine learning (ML), and natural language processing (NLP) has revolutionized the data analysis landscape. Approximately 65% of organizations are now leveraging these technologies to streamline their analytics workflows, automating tasks such as data cleaning, anomaly detection, and predictive analytics. The integration of data mesh architectures is facilitating collaborative data sharing among cross-functional teams, fostering an environment where data-driven cultures can thrive. Moreover, the rise of edge computing supports real-time analytics, allowing businesses to act swiftly on sensor data and enhance overall operational efficiency. As organizations increasingly prioritize data-driven strategies, the demand for skilled data analysts continues to expand. The importance of robust business intelligence software and data analytics tools cannot be overstated, as they empower teams to glean insights from complex datasets effectively. It is within this evolving context that data analysis plays a central role in shaping the future of business, ensuring organizations remain competitive and responsive to market dynamics.
What is A/B testing and how does it work?
A/B testing is an invaluable marketing experiment that helps businesses understand customer behaviors and optimize content. It works by splitting your audience to test two different versions of the same thing - like email subject lines, landing pages, or CTAs - to determine which performs better. The goal is to gather data that allows you to make informed decisions to positively impact business outcomes such as increased engagement, sales, and conversion rates. When conducting A/B tests, it's crucial to test one element at a time, ensure adequate sample size, and verify statistical significance before implementing changes.
Watch clip answer (09:10m)
HubSpot Marketing
00:00 - 09:11
What are the key features and benefits of Python in Excel?
Python in Excel integrates directly into the Excel environment through the new PY function, requiring no installation. Users can leverage popular Python libraries like Pandas and matplotlib within their Excel workbooks to create visualizations, train machine learning models, and perform advanced analytics. The system runs securely in Microsoft Cloud as a compliant Microsoft 365 service, protecting data privacy. This integration works seamlessly with Excel's native features including formulas, charts, pivot tables, and conditional formatting, combining Excel's flexibility with Python's analytical power to enhance data-driven decision making and storytelling.
Watch clip answer (01:25m)
Microsoft 365
00:02 - 01:27
How can you extract job posting data from LinkedIn without coding?
You can easily extract LinkedIn job data using WebAutomation IO's predefined extractor without writing any code. The process involves signing up for WebAutomation IO, accessing the LinkedIn jobs extractor from the marketplace, and pasting a LinkedIn job search URL. You can specify how many job listings to scrape (or leave it at zero to extract all jobs). Once you run the extractor, the system automatically collects comprehensive job information including titles, companies, locations, posting dates, applicant counts, employment types, and full descriptions. The data can then be downloaded in various formats including CSV, Excel, XML, or JSON for your analysis or business needs.
Watch clip answer (03:17m)
WebAutomation
00:05 - 03:22
What are pivot tables and why are they important in Excel?
Pivot tables are one of Excel's most powerful features that allow users to extract significance from large, detailed data sets. They help transform raw data into meaningful insights by summarizing information like employee data, total hours, and patient metrics. What makes pivot tables especially valuable is their ability to automatically update when the source data changes. This live updating feature extends to any charts created from the pivot table, ensuring all visualizations stay current without manual intervention. This dynamic connection between source data, pivot tables, and charts creates an efficient workflow for data analysis in Excel.
Watch clip answer (07:14m)
Logan Phillips
25:06 - 32:20
How is data science transforming life sciences research?
Data science is revolutionizing life sciences through advanced analysis of vast biological datasets. It plays crucial roles in genomics, where machine learning algorithms analyze genetic variations linked to diseases, and proteomics, where it helps identify key proteins and pathways. Most significantly, it enables personalized medicine by analyzing patient data to tailor treatments to individual needs. Additionally, data science has improved drug discovery by analyzing molecular and chemical data, leading to more effective targeted therapies and deeper understanding of disease mechanisms.
Watch clip answer (05:40m)
BioTech Whisperer
00:59 - 06:39
How can multiple visualizations be organized in Tableau?
In Tableau, multiple visualizations can be organized by grouping them together into a cohesive dashboard. The speaker demonstrates this by working with four different visualizations, first labeling one as "enrollment total" and then planning to group all four visuals together for a more comprehensive view. This grouping feature allows users to combine related visualizations into a single display, making it easier for viewers to see connections between different data points. By organizing multiple charts and graphs together, Tableau enables more effective data storytelling and helps highlight important insights that might not be apparent when viewing visualizations separately.
Watch clip answer (00:17m)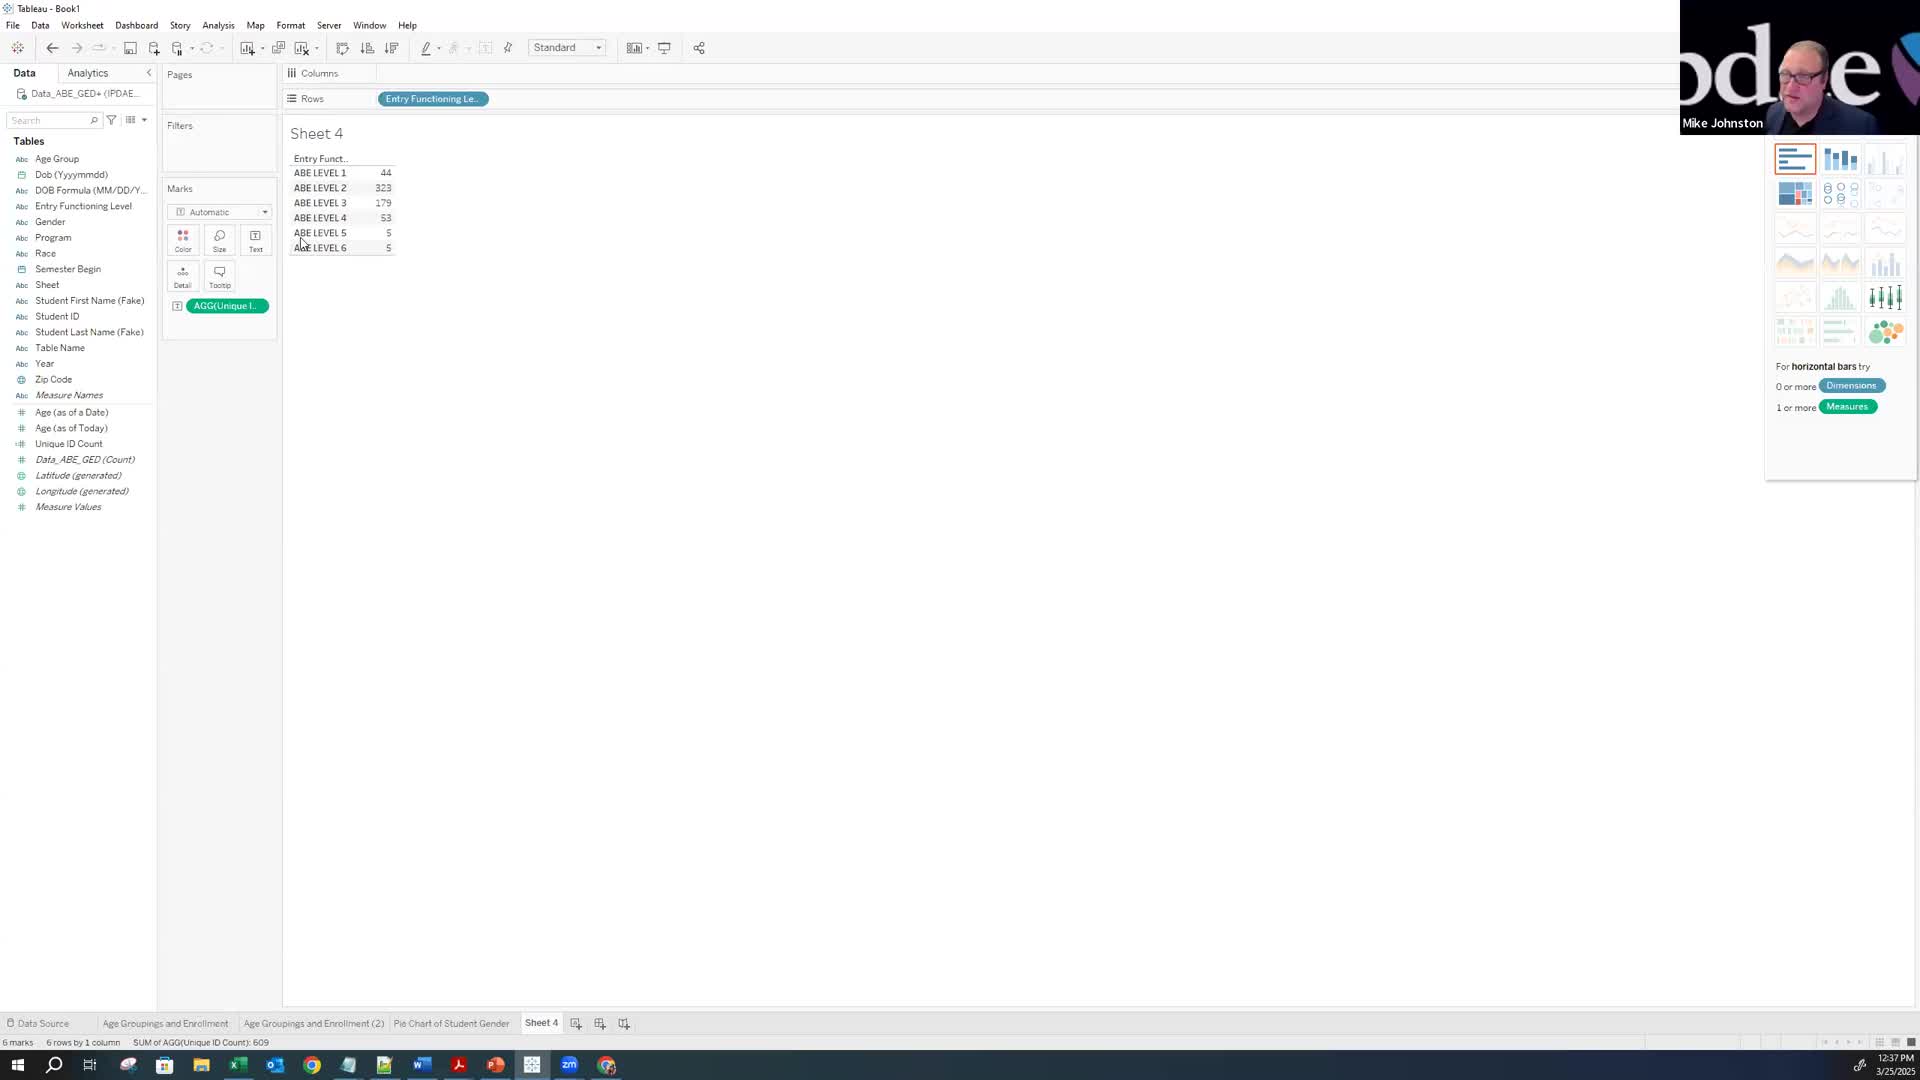
IPDAE
40:31 - 40:48